Immigrants from Iran vs Immigrants from Argentina In Labor Force | Age 20-24
COMPARE
Immigrants from Iran
Immigrants from Argentina
In Labor Force | Age 20-24
In Labor Force | Age 20-24 Comparison
Immigrants from Iran
Immigrants from Argentina
71.8%
IN LABOR FORCE | AGE 20-24
0.0/ 100
METRIC RATING
315th/ 347
METRIC RANK
72.8%
IN LABOR FORCE | AGE 20-24
0.0/ 100
METRIC RATING
294th/ 347
METRIC RANK
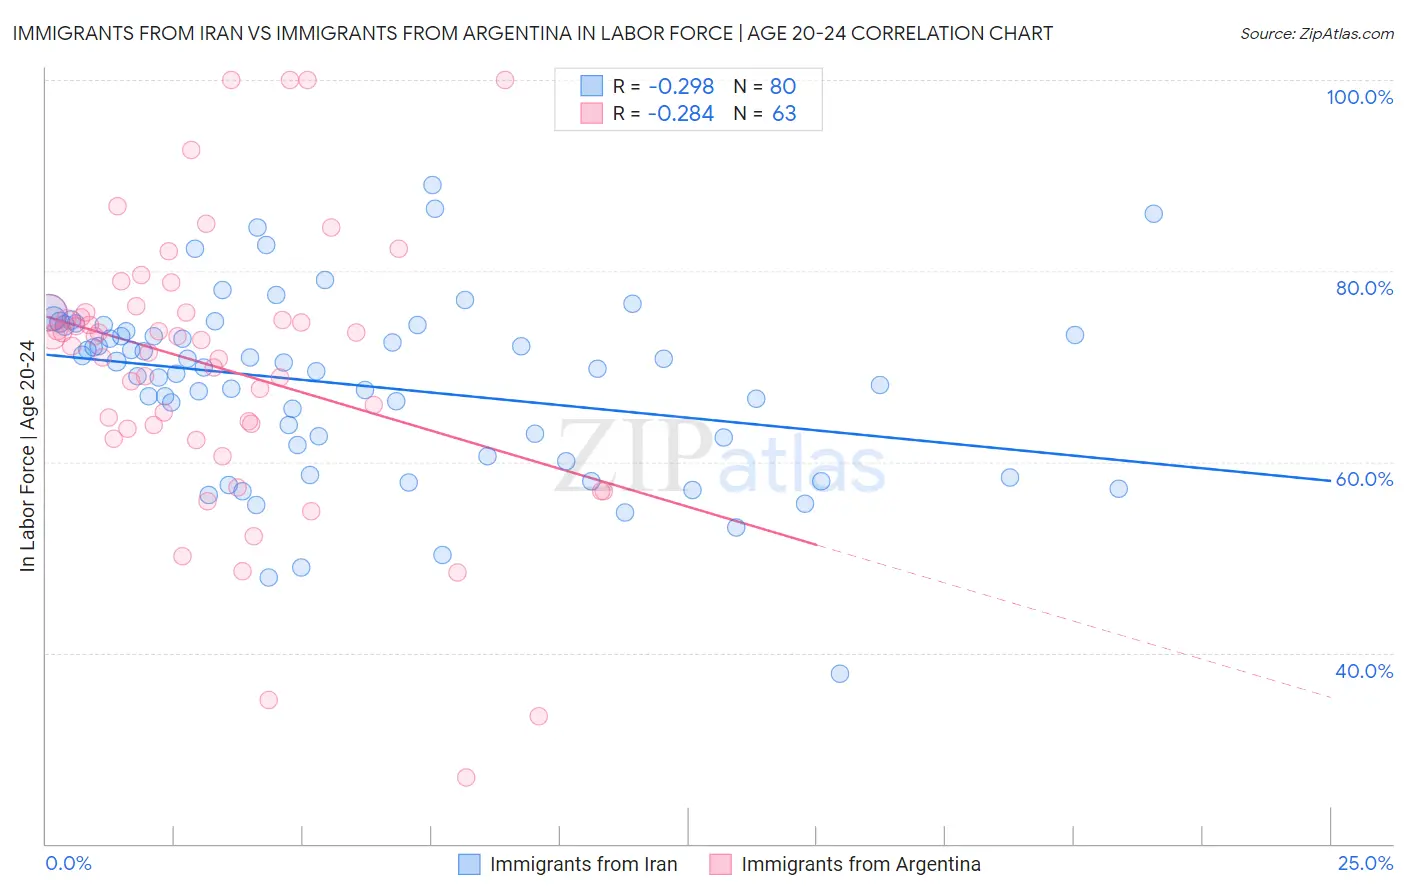
Immigrants from Iran vs Immigrants from Argentina In Labor Force | Age 20-24 Correlation Chart
The statistical analysis conducted on geographies consisting of 279,798,180 people shows a weak negative correlation between the proportion of Immigrants from Iran and labor force participation rate among population between the ages 20 and 24 in the United States with a correlation coefficient (R) of -0.298 and weighted average of 71.8%. Similarly, the statistical analysis conducted on geographies consisting of 264,369,476 people shows a weak negative correlation between the proportion of Immigrants from Argentina and labor force participation rate among population between the ages 20 and 24 in the United States with a correlation coefficient (R) of -0.284 and weighted average of 72.8%, a difference of 1.4%.
In Labor Force | Age 20-24 Correlation Summary
| Measurement | Immigrants from Iran | Immigrants from Argentina |
| Minimum | 37.8% | 26.9% |
| Maximum | 89.0% | 100.0% |
| Range | 51.2% | 73.1% |
| Mean | 68.0% | 69.9% |
| Median | 69.8% | 72.8% |
| Interquartile 25% (IQ1) | 61.2% | 63.5% |
| Interquartile 75% (IQ3) | 74.0% | 75.7% |
| Interquartile Range (IQR) | 12.8% | 12.2% |
| Standard Deviation (Sample) | 9.5% | 14.6% |
| Standard Deviation (Population) | 9.4% | 14.5% |
Similar Demographics by In Labor Force | Age 20-24
Demographics Similar to Immigrants from Iran by In Labor Force | Age 20-24
In terms of in labor force | age 20-24, the demographic groups most similar to Immigrants from Iran are Immigrants from Eastern Asia (71.8%, a difference of 0.040%), Immigrants from Dominica (71.9%, a difference of 0.090%), Indian (Asian) (71.9%, a difference of 0.090%), Immigrants from Caribbean (71.9%, a difference of 0.14%), and Immigrants from Armenia (71.7%, a difference of 0.21%).
| Demographics | Rating | Rank | In Labor Force | Age 20-24 |
| Soviet Union | 0.0 /100 | #308 | Tragic 72.3% |
| Tsimshian | 0.0 /100 | #309 | Tragic 72.3% |
| Immigrants | Cuba | 0.0 /100 | #310 | Tragic 72.0% |
| Apache | 0.0 /100 | #311 | Tragic 72.0% |
| Immigrants | Caribbean | 0.0 /100 | #312 | Tragic 71.9% |
| Immigrants | Dominica | 0.0 /100 | #313 | Tragic 71.9% |
| Indians (Asian) | 0.0 /100 | #314 | Tragic 71.9% |
| Immigrants | Iran | 0.0 /100 | #315 | Tragic 71.8% |
| Immigrants | Eastern Asia | 0.0 /100 | #316 | Tragic 71.8% |
| Immigrants | Armenia | 0.0 /100 | #317 | Tragic 71.7% |
| Immigrants | Hong Kong | 0.0 /100 | #318 | Tragic 71.6% |
| Immigrants | Israel | 0.0 /100 | #319 | Tragic 71.6% |
| Trinidadians and Tobagonians | 0.0 /100 | #320 | Tragic 71.5% |
| Immigrants | Taiwan | 0.0 /100 | #321 | Tragic 71.5% |
| Filipinos | 0.0 /100 | #322 | Tragic 71.4% |
Demographics Similar to Immigrants from Argentina by In Labor Force | Age 20-24
In terms of in labor force | age 20-24, the demographic groups most similar to Immigrants from Argentina are Immigrants from Belize (72.8%, a difference of 0.030%), Pueblo (72.9%, a difference of 0.090%), Okinawan (72.7%, a difference of 0.11%), Jamaican (72.7%, a difference of 0.11%), and Central American Indian (72.7%, a difference of 0.16%).
| Demographics | Rating | Rank | In Labor Force | Age 20-24 |
| Immigrants | Korea | 0.1 /100 | #287 | Tragic 73.1% |
| Argentineans | 0.1 /100 | #288 | Tragic 73.1% |
| U.S. Virgin Islanders | 0.1 /100 | #289 | Tragic 73.0% |
| Immigrants | Belarus | 0.1 /100 | #290 | Tragic 73.0% |
| Immigrants | Nicaragua | 0.0 /100 | #291 | Tragic 72.9% |
| Pueblo | 0.0 /100 | #292 | Tragic 72.9% |
| Immigrants | Belize | 0.0 /100 | #293 | Tragic 72.8% |
| Immigrants | Argentina | 0.0 /100 | #294 | Tragic 72.8% |
| Okinawans | 0.0 /100 | #295 | Tragic 72.7% |
| Jamaicans | 0.0 /100 | #296 | Tragic 72.7% |
| Central American Indians | 0.0 /100 | #297 | Tragic 72.7% |
| Israelis | 0.0 /100 | #298 | Tragic 72.6% |
| Iranians | 0.0 /100 | #299 | Tragic 72.6% |
| Armenians | 0.0 /100 | #300 | Tragic 72.5% |
| Cubans | 0.0 /100 | #301 | Tragic 72.5% |