Immigrants from Croatia vs Ukrainian In Labor Force | Age > 16
COMPARE
Immigrants from Croatia
Ukrainian
In Labor Force | Age > 16
In Labor Force | Age > 16 Comparison
Immigrants from Croatia
Ukrainians
65.0%
IN LABOR FORCE | AGE > 16
35.7/ 100
METRIC RATING
187th/ 347
METRIC RANK
64.9%
IN LABOR FORCE | AGE > 16
19.6/ 100
METRIC RATING
201st/ 347
METRIC RANK
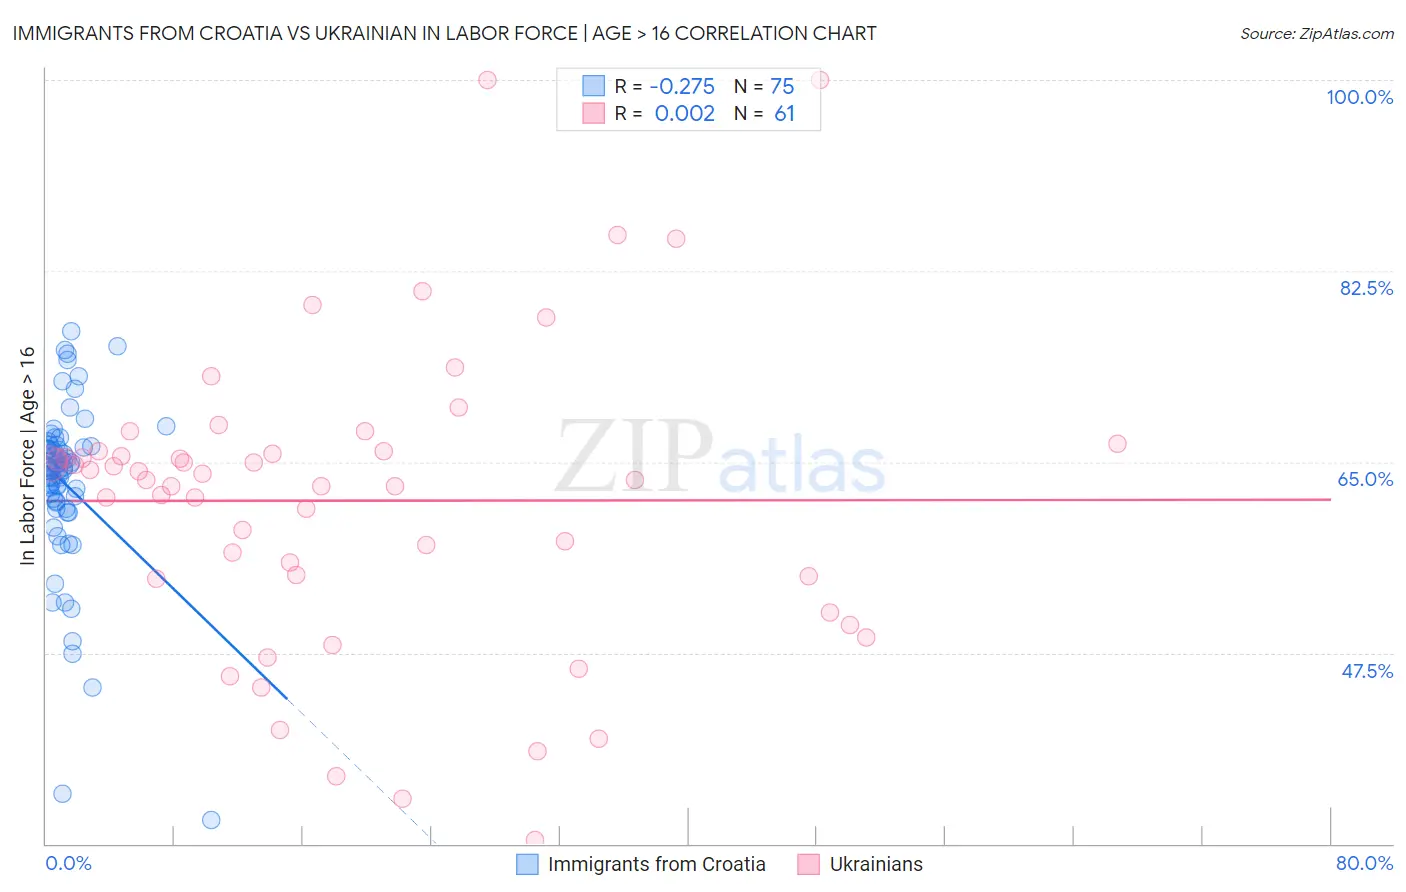
Immigrants from Croatia vs Ukrainian In Labor Force | Age > 16 Correlation Chart
The statistical analysis conducted on geographies consisting of 132,563,331 people shows a weak negative correlation between the proportion of Immigrants from Croatia and labor force participation rate among population ages 16 and over in the United States with a correlation coefficient (R) of -0.275 and weighted average of 65.0%. Similarly, the statistical analysis conducted on geographies consisting of 448,710,826 people shows no correlation between the proportion of Ukrainians and labor force participation rate among population ages 16 and over in the United States with a correlation coefficient (R) of 0.002 and weighted average of 64.9%, a difference of 0.23%.
In Labor Force | Age > 16 Correlation Summary
| Measurement | Immigrants from Croatia | Ukrainian |
| Minimum | 32.2% | 30.4% |
| Maximum | 77.0% | 100.0% |
| Range | 44.8% | 69.6% |
| Mean | 63.0% | 61.4% |
| Median | 64.4% | 63.4% |
| Interquartile 25% (IQ1) | 61.3% | 54.4% |
| Interquartile 75% (IQ3) | 66.4% | 66.0% |
| Interquartile Range (IQR) | 5.1% | 11.6% |
| Standard Deviation (Sample) | 7.9% | 13.8% |
| Standard Deviation (Population) | 7.8% | 13.7% |
Demographics Similar to Immigrants from Croatia and Ukrainians by In Labor Force | Age > 16
In terms of in labor force | age > 16, the demographic groups most similar to Immigrants from Croatia are Immigrants from Portugal (65.0%, a difference of 0.010%), Immigrants from Greece (65.0%, a difference of 0.020%), Barbadian (65.0%, a difference of 0.020%), Scandinavian (65.0%, a difference of 0.020%), and Immigrants from Switzerland (65.0%, a difference of 0.030%). Similarly, the demographic groups most similar to Ukrainians are Immigrants from Belgium (64.9%, a difference of 0.0%), Armenian (64.9%, a difference of 0.010%), Russian (64.9%, a difference of 0.010%), Slovene (64.9%, a difference of 0.020%), and Mexican American Indian (64.9%, a difference of 0.060%).
| Demographics | Rating | Rank | In Labor Force | Age > 16 |
| Carpatho Rusyns | 40.0 /100 | #184 | Average 65.0% |
| Syrians | 40.0 /100 | #185 | Average 65.0% |
| Immigrants | Switzerland | 38.2 /100 | #186 | Fair 65.0% |
| Immigrants | Croatia | 35.7 /100 | #187 | Fair 65.0% |
| Immigrants | Portugal | 34.8 /100 | #188 | Fair 65.0% |
| Immigrants | Greece | 34.3 /100 | #189 | Fair 65.0% |
| Barbadians | 33.9 /100 | #190 | Fair 65.0% |
| Scandinavians | 33.7 /100 | #191 | Fair 65.0% |
| Immigrants | Fiji | 33.7 /100 | #192 | Fair 65.0% |
| Immigrants | Europe | 33.6 /100 | #193 | Fair 65.0% |
| Immigrants | Southern Europe | 31.3 /100 | #194 | Fair 65.0% |
| Romanians | 31.1 /100 | #195 | Fair 65.0% |
| Haitians | 30.6 /100 | #196 | Fair 65.0% |
| Immigrants | Italy | 28.7 /100 | #197 | Fair 65.0% |
| Greeks | 26.1 /100 | #198 | Fair 64.9% |
| Mexican American Indians | 23.1 /100 | #199 | Fair 64.9% |
| Armenians | 20.2 /100 | #200 | Fair 64.9% |
| Ukrainians | 19.6 /100 | #201 | Poor 64.9% |
| Immigrants | Belgium | 19.4 /100 | #202 | Poor 64.9% |
| Russians | 18.8 /100 | #203 | Poor 64.9% |
| Slovenes | 18.7 /100 | #204 | Poor 64.9% |