Immigrants from Croatia vs Immigrants from Cameroon In Labor Force | Age > 16
COMPARE
Immigrants from Croatia
Immigrants from Cameroon
In Labor Force | Age > 16
In Labor Force | Age > 16 Comparison
Immigrants from Croatia
Immigrants from Cameroon
65.0%
IN LABOR FORCE | AGE > 16
35.7/ 100
METRIC RATING
187th/ 347
METRIC RANK
68.7%
IN LABOR FORCE | AGE > 16
100.0/ 100
METRIC RATING
7th/ 347
METRIC RANK
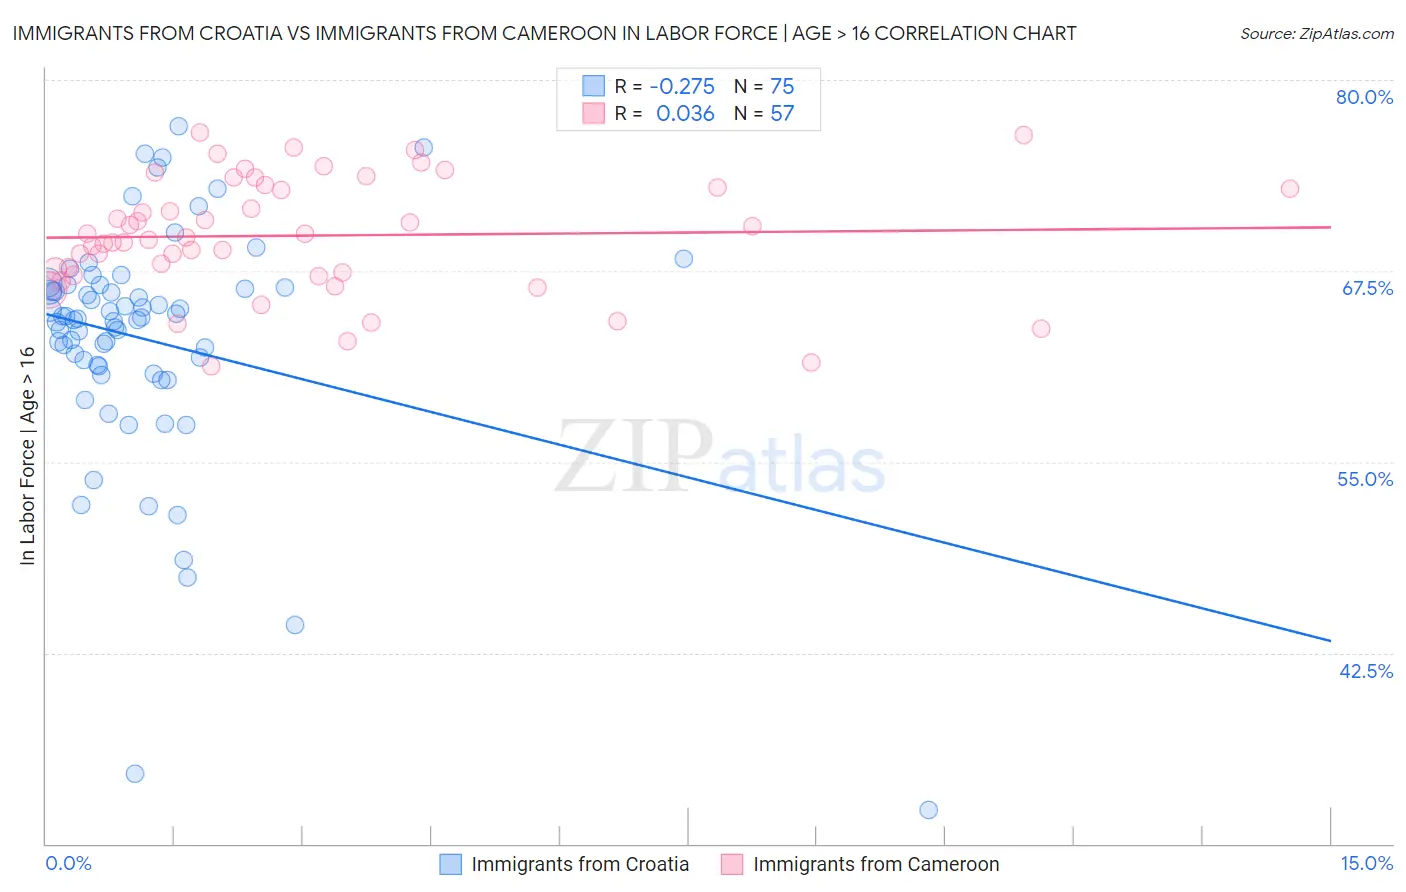
Immigrants from Croatia vs Immigrants from Cameroon In Labor Force | Age > 16 Correlation Chart
The statistical analysis conducted on geographies consisting of 132,563,331 people shows a weak negative correlation between the proportion of Immigrants from Croatia and labor force participation rate among population ages 16 and over in the United States with a correlation coefficient (R) of -0.275 and weighted average of 65.0%. Similarly, the statistical analysis conducted on geographies consisting of 130,760,472 people shows no correlation between the proportion of Immigrants from Cameroon and labor force participation rate among population ages 16 and over in the United States with a correlation coefficient (R) of 0.036 and weighted average of 68.7%, a difference of 5.7%.
In Labor Force | Age > 16 Correlation Summary
| Measurement | Immigrants from Croatia | Immigrants from Cameroon |
| Minimum | 32.2% | 61.3% |
| Maximum | 77.0% | 76.5% |
| Range | 44.8% | 15.3% |
| Mean | 63.0% | 69.8% |
| Median | 64.4% | 69.7% |
| Interquartile 25% (IQ1) | 61.3% | 67.3% |
| Interquartile 75% (IQ3) | 66.4% | 73.1% |
| Interquartile Range (IQR) | 5.1% | 5.7% |
| Standard Deviation (Sample) | 7.9% | 3.8% |
| Standard Deviation (Population) | 7.8% | 3.8% |
Similar Demographics by In Labor Force | Age > 16
Demographics Similar to Immigrants from Croatia by In Labor Force | Age > 16
In terms of in labor force | age > 16, the demographic groups most similar to Immigrants from Croatia are Immigrants from Portugal (65.0%, a difference of 0.010%), Immigrants from Greece (65.0%, a difference of 0.020%), Barbadian (65.0%, a difference of 0.020%), Scandinavian (65.0%, a difference of 0.020%), and Immigrants from Switzerland (65.0%, a difference of 0.030%).
| Demographics | Rating | Rank | In Labor Force | Age > 16 |
| Immigrants | Latvia | 42.9 /100 | #180 | Average 65.1% |
| Immigrants | Panama | 42.4 /100 | #181 | Average 65.1% |
| Immigrants | Nicaragua | 41.1 /100 | #182 | Average 65.1% |
| Soviet Union | 40.5 /100 | #183 | Average 65.0% |
| Carpatho Rusyns | 40.0 /100 | #184 | Average 65.0% |
| Syrians | 40.0 /100 | #185 | Average 65.0% |
| Immigrants | Switzerland | 38.2 /100 | #186 | Fair 65.0% |
| Immigrants | Croatia | 35.7 /100 | #187 | Fair 65.0% |
| Immigrants | Portugal | 34.8 /100 | #188 | Fair 65.0% |
| Immigrants | Greece | 34.3 /100 | #189 | Fair 65.0% |
| Barbadians | 33.9 /100 | #190 | Fair 65.0% |
| Scandinavians | 33.7 /100 | #191 | Fair 65.0% |
| Immigrants | Fiji | 33.7 /100 | #192 | Fair 65.0% |
| Immigrants | Europe | 33.6 /100 | #193 | Fair 65.0% |
| Immigrants | Southern Europe | 31.3 /100 | #194 | Fair 65.0% |
Demographics Similar to Immigrants from Cameroon by In Labor Force | Age > 16
In terms of in labor force | age > 16, the demographic groups most similar to Immigrants from Cameroon are Immigrants from Eritrea (68.9%, a difference of 0.25%), Sierra Leonean (68.9%, a difference of 0.30%), Immigrants from Sierra Leone (68.5%, a difference of 0.32%), Immigrants from Eastern Africa (68.5%, a difference of 0.33%), and Immigrants from Bolivia (68.4%, a difference of 0.36%).
| Demographics | Rating | Rank | In Labor Force | Age > 16 |
| Immigrants | Ethiopia | 100.0 /100 | #1 | Exceptional 69.4% |
| Ethiopians | 100.0 /100 | #2 | Exceptional 69.3% |
| Somalis | 100.0 /100 | #3 | Exceptional 69.2% |
| Immigrants | Somalia | 100.0 /100 | #4 | Exceptional 69.1% |
| Sierra Leoneans | 100.0 /100 | #5 | Exceptional 68.9% |
| Immigrants | Eritrea | 100.0 /100 | #6 | Exceptional 68.9% |
| Immigrants | Cameroon | 100.0 /100 | #7 | Exceptional 68.7% |
| Immigrants | Sierra Leone | 100.0 /100 | #8 | Exceptional 68.5% |
| Immigrants | Eastern Africa | 100.0 /100 | #9 | Exceptional 68.5% |
| Immigrants | Bolivia | 100.0 /100 | #10 | Exceptional 68.4% |
| Bolivians | 100.0 /100 | #11 | Exceptional 68.2% |
| Sudanese | 100.0 /100 | #12 | Exceptional 68.0% |
| Immigrants | Nepal | 100.0 /100 | #13 | Exceptional 68.0% |
| Liberians | 100.0 /100 | #14 | Exceptional 67.8% |
| Immigrants | Middle Africa | 100.0 /100 | #15 | Exceptional 67.7% |