Immigrants from Croatia vs Immigrants from Yemen In Labor Force | Age > 16
COMPARE
Immigrants from Croatia
Immigrants from Yemen
In Labor Force | Age > 16
In Labor Force | Age > 16 Comparison
Immigrants from Croatia
Immigrants from Yemen
65.0%
IN LABOR FORCE | AGE > 16
35.7/ 100
METRIC RATING
187th/ 347
METRIC RANK
59.6%
IN LABOR FORCE | AGE > 16
0.0/ 100
METRIC RATING
338th/ 347
METRIC RANK
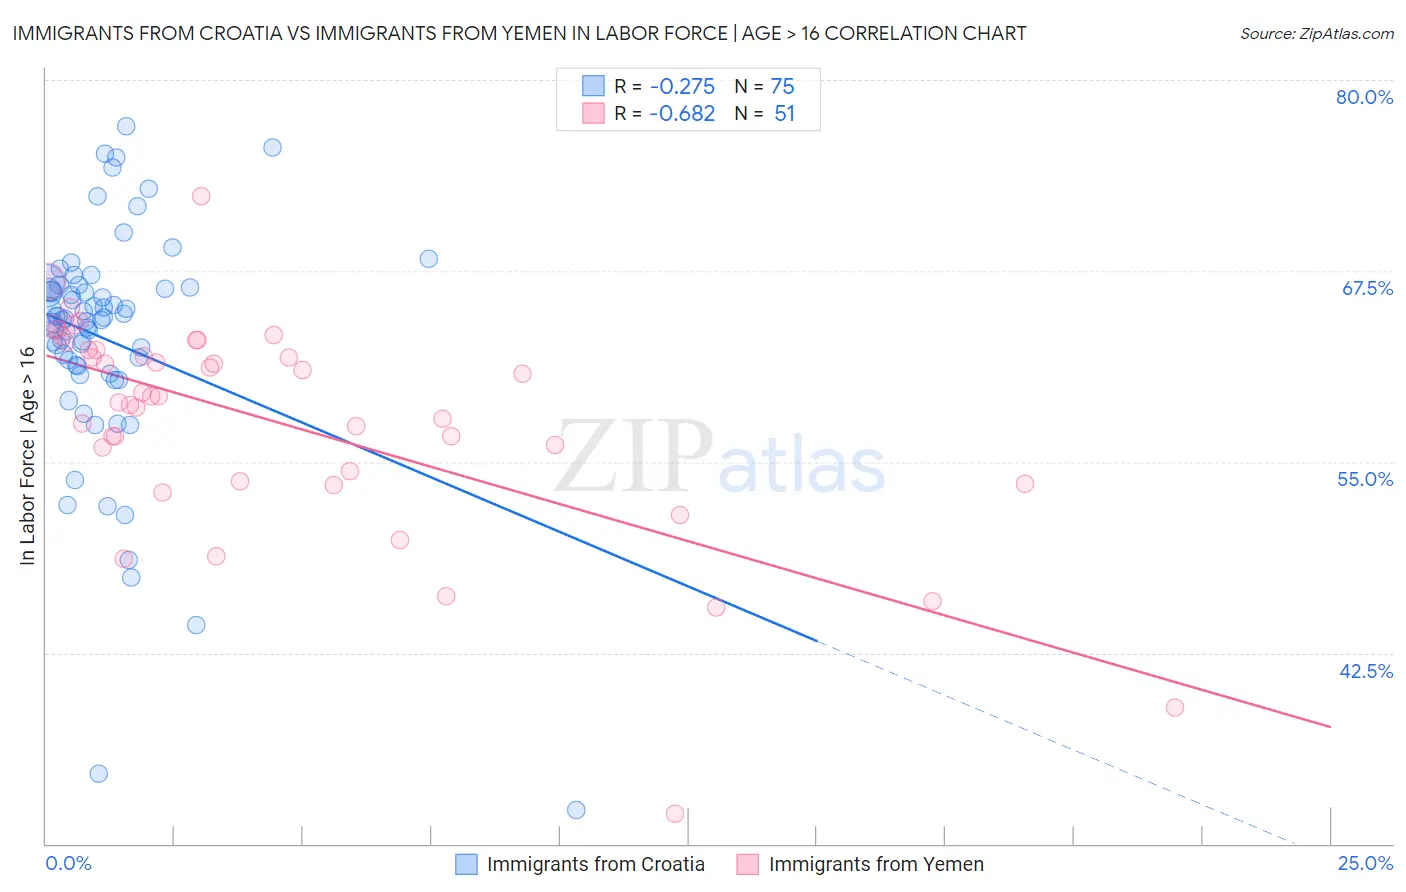
Immigrants from Croatia vs Immigrants from Yemen In Labor Force | Age > 16 Correlation Chart
The statistical analysis conducted on geographies consisting of 132,563,331 people shows a weak negative correlation between the proportion of Immigrants from Croatia and labor force participation rate among population ages 16 and over in the United States with a correlation coefficient (R) of -0.275 and weighted average of 65.0%. Similarly, the statistical analysis conducted on geographies consisting of 82,433,611 people shows a significant negative correlation between the proportion of Immigrants from Yemen and labor force participation rate among population ages 16 and over in the United States with a correlation coefficient (R) of -0.682 and weighted average of 59.6%, a difference of 9.0%.
In Labor Force | Age > 16 Correlation Summary
| Measurement | Immigrants from Croatia | Immigrants from Yemen |
| Minimum | 32.2% | 32.0% |
| Maximum | 77.0% | 72.4% |
| Range | 44.8% | 40.4% |
| Mean | 63.0% | 57.6% |
| Median | 64.4% | 59.3% |
| Interquartile 25% (IQ1) | 61.3% | 53.7% |
| Interquartile 75% (IQ3) | 66.4% | 62.3% |
| Interquartile Range (IQR) | 5.1% | 8.6% |
| Standard Deviation (Sample) | 7.9% | 7.2% |
| Standard Deviation (Population) | 7.8% | 7.2% |
Similar Demographics by In Labor Force | Age > 16
Demographics Similar to Immigrants from Croatia by In Labor Force | Age > 16
In terms of in labor force | age > 16, the demographic groups most similar to Immigrants from Croatia are Immigrants from Portugal (65.0%, a difference of 0.010%), Immigrants from Greece (65.0%, a difference of 0.020%), Barbadian (65.0%, a difference of 0.020%), Scandinavian (65.0%, a difference of 0.020%), and Immigrants from Switzerland (65.0%, a difference of 0.030%).
| Demographics | Rating | Rank | In Labor Force | Age > 16 |
| Immigrants | Latvia | 42.9 /100 | #180 | Average 65.1% |
| Immigrants | Panama | 42.4 /100 | #181 | Average 65.1% |
| Immigrants | Nicaragua | 41.1 /100 | #182 | Average 65.1% |
| Soviet Union | 40.5 /100 | #183 | Average 65.0% |
| Carpatho Rusyns | 40.0 /100 | #184 | Average 65.0% |
| Syrians | 40.0 /100 | #185 | Average 65.0% |
| Immigrants | Switzerland | 38.2 /100 | #186 | Fair 65.0% |
| Immigrants | Croatia | 35.7 /100 | #187 | Fair 65.0% |
| Immigrants | Portugal | 34.8 /100 | #188 | Fair 65.0% |
| Immigrants | Greece | 34.3 /100 | #189 | Fair 65.0% |
| Barbadians | 33.9 /100 | #190 | Fair 65.0% |
| Scandinavians | 33.7 /100 | #191 | Fair 65.0% |
| Immigrants | Fiji | 33.7 /100 | #192 | Fair 65.0% |
| Immigrants | Europe | 33.6 /100 | #193 | Fair 65.0% |
| Immigrants | Southern Europe | 31.3 /100 | #194 | Fair 65.0% |
Demographics Similar to Immigrants from Yemen by In Labor Force | Age > 16
In terms of in labor force | age > 16, the demographic groups most similar to Immigrants from Yemen are Houma (59.5%, a difference of 0.25%), Colville (59.8%, a difference of 0.27%), Pueblo (59.3%, a difference of 0.64%), Menominee (60.6%, a difference of 1.5%), and Native/Alaskan (60.6%, a difference of 1.6%).
| Demographics | Rating | Rank | In Labor Force | Age > 16 |
| Ute | 0.0 /100 | #331 | Tragic 60.9% |
| Crow | 0.0 /100 | #332 | Tragic 60.8% |
| Paiute | 0.0 /100 | #333 | Tragic 60.7% |
| Apache | 0.0 /100 | #334 | Tragic 60.7% |
| Natives/Alaskans | 0.0 /100 | #335 | Tragic 60.6% |
| Menominee | 0.0 /100 | #336 | Tragic 60.6% |
| Colville | 0.0 /100 | #337 | Tragic 59.8% |
| Immigrants | Yemen | 0.0 /100 | #338 | Tragic 59.6% |
| Houma | 0.0 /100 | #339 | Tragic 59.5% |
| Pueblo | 0.0 /100 | #340 | Tragic 59.3% |
| Hopi | 0.0 /100 | #341 | Tragic 58.4% |
| Puerto Ricans | 0.0 /100 | #342 | Tragic 58.1% |
| Yuman | 0.0 /100 | #343 | Tragic 57.8% |
| Pima | 0.0 /100 | #344 | Tragic 57.4% |
| Tohono O'odham | 0.0 /100 | #345 | Tragic 57.2% |