Immigrants from Croatia vs Bahamian In Labor Force | Age > 16
COMPARE
Immigrants from Croatia
Bahamian
In Labor Force | Age > 16
In Labor Force | Age > 16 Comparison
Immigrants from Croatia
Bahamians
65.0%
IN LABOR FORCE | AGE > 16
35.7/ 100
METRIC RATING
187th/ 347
METRIC RANK
64.2%
IN LABOR FORCE | AGE > 16
0.6/ 100
METRIC RATING
263rd/ 347
METRIC RANK
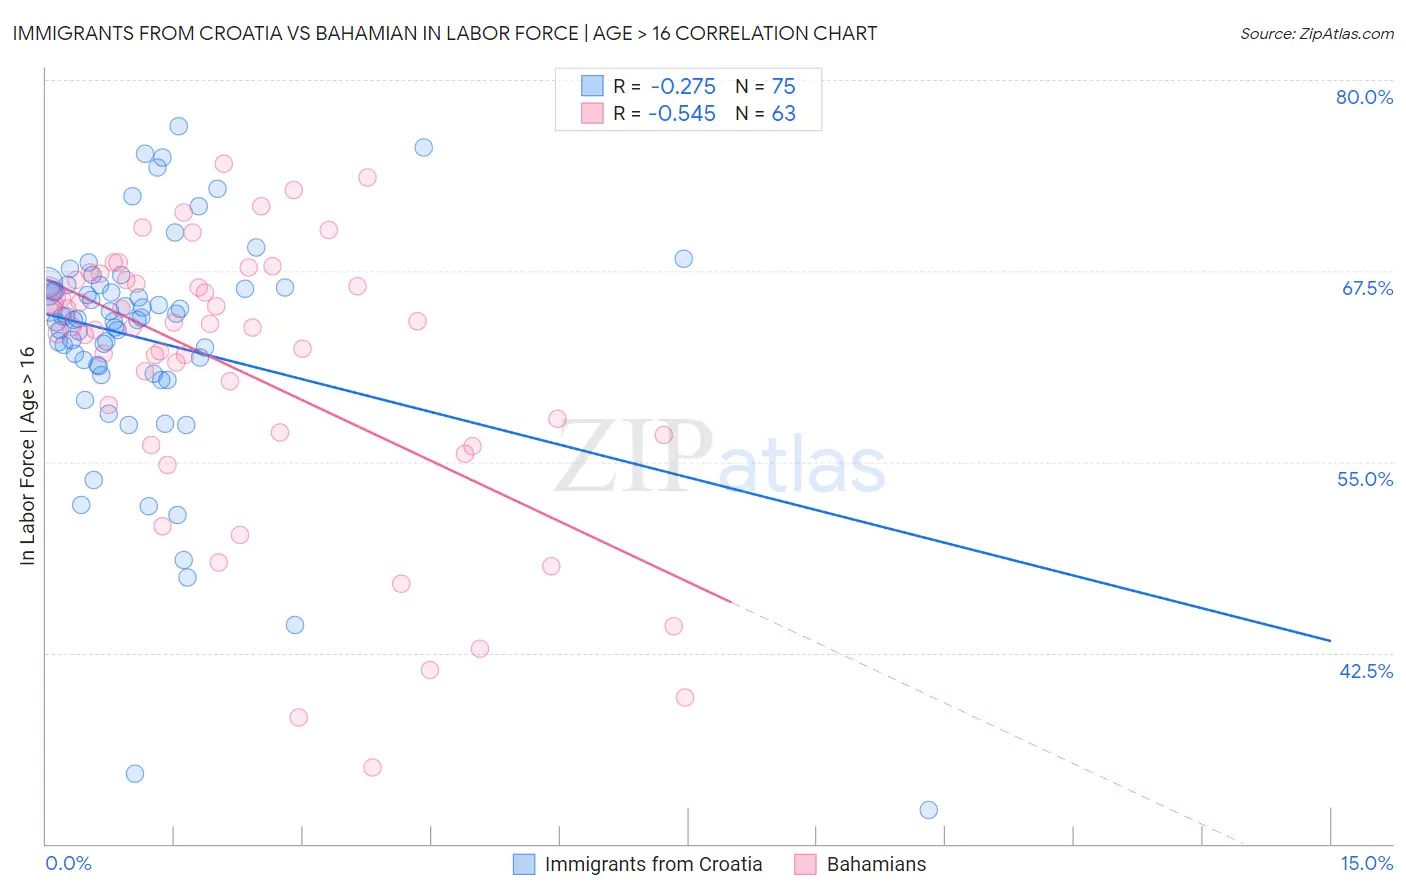
Immigrants from Croatia vs Bahamian In Labor Force | Age > 16 Correlation Chart
The statistical analysis conducted on geographies consisting of 132,563,331 people shows a weak negative correlation between the proportion of Immigrants from Croatia and labor force participation rate among population ages 16 and over in the United States with a correlation coefficient (R) of -0.275 and weighted average of 65.0%. Similarly, the statistical analysis conducted on geographies consisting of 112,706,440 people shows a substantial negative correlation between the proportion of Bahamians and labor force participation rate among population ages 16 and over in the United States with a correlation coefficient (R) of -0.545 and weighted average of 64.2%, a difference of 1.3%.
In Labor Force | Age > 16 Correlation Summary
| Measurement | Immigrants from Croatia | Bahamian |
| Minimum | 32.2% | 35.0% |
| Maximum | 77.0% | 74.5% |
| Range | 44.8% | 39.5% |
| Mean | 63.0% | 61.0% |
| Median | 64.4% | 63.8% |
| Interquartile 25% (IQ1) | 61.3% | 56.8% |
| Interquartile 75% (IQ3) | 66.4% | 66.9% |
| Interquartile Range (IQR) | 5.1% | 10.1% |
| Standard Deviation (Sample) | 7.9% | 9.1% |
| Standard Deviation (Population) | 7.8% | 9.1% |
Similar Demographics by In Labor Force | Age > 16
Demographics Similar to Immigrants from Croatia by In Labor Force | Age > 16
In terms of in labor force | age > 16, the demographic groups most similar to Immigrants from Croatia are Immigrants from Portugal (65.0%, a difference of 0.010%), Immigrants from Greece (65.0%, a difference of 0.020%), Barbadian (65.0%, a difference of 0.020%), Scandinavian (65.0%, a difference of 0.020%), and Immigrants from Switzerland (65.0%, a difference of 0.030%).
| Demographics | Rating | Rank | In Labor Force | Age > 16 |
| Immigrants | Latvia | 42.9 /100 | #180 | Average 65.1% |
| Immigrants | Panama | 42.4 /100 | #181 | Average 65.1% |
| Immigrants | Nicaragua | 41.1 /100 | #182 | Average 65.1% |
| Soviet Union | 40.5 /100 | #183 | Average 65.0% |
| Carpatho Rusyns | 40.0 /100 | #184 | Average 65.0% |
| Syrians | 40.0 /100 | #185 | Average 65.0% |
| Immigrants | Switzerland | 38.2 /100 | #186 | Fair 65.0% |
| Immigrants | Croatia | 35.7 /100 | #187 | Fair 65.0% |
| Immigrants | Portugal | 34.8 /100 | #188 | Fair 65.0% |
| Immigrants | Greece | 34.3 /100 | #189 | Fair 65.0% |
| Barbadians | 33.9 /100 | #190 | Fair 65.0% |
| Scandinavians | 33.7 /100 | #191 | Fair 65.0% |
| Immigrants | Fiji | 33.7 /100 | #192 | Fair 65.0% |
| Immigrants | Europe | 33.6 /100 | #193 | Fair 65.0% |
| Immigrants | Southern Europe | 31.3 /100 | #194 | Fair 65.0% |
Demographics Similar to Bahamians by In Labor Force | Age > 16
In terms of in labor force | age > 16, the demographic groups most similar to Bahamians are Finnish (64.2%, a difference of 0.010%), Dutch (64.2%, a difference of 0.020%), Marshallese (64.2%, a difference of 0.030%), Basque (64.2%, a difference of 0.030%), and Immigrants from Western Europe (64.2%, a difference of 0.040%).
| Demographics | Rating | Rank | In Labor Force | Age > 16 |
| Immigrants | Mexico | 1.0 /100 | #256 | Tragic 64.3% |
| Inupiat | 0.8 /100 | #257 | Tragic 64.3% |
| Immigrants | Scotland | 0.8 /100 | #258 | Tragic 64.2% |
| Immigrants | Western Europe | 0.7 /100 | #259 | Tragic 64.2% |
| Marshallese | 0.7 /100 | #260 | Tragic 64.2% |
| Basques | 0.7 /100 | #261 | Tragic 64.2% |
| Finns | 0.7 /100 | #262 | Tragic 64.2% |
| Bahamians | 0.6 /100 | #263 | Tragic 64.2% |
| Dutch | 0.6 /100 | #264 | Tragic 64.2% |
| Cubans | 0.5 /100 | #265 | Tragic 64.2% |
| Immigrants | England | 0.5 /100 | #266 | Tragic 64.2% |
| Canadians | 0.5 /100 | #267 | Tragic 64.1% |
| Spaniards | 0.5 /100 | #268 | Tragic 64.1% |
| Irish | 0.4 /100 | #269 | Tragic 64.1% |
| Guyanese | 0.4 /100 | #270 | Tragic 64.1% |