Immigrants from Croatia vs Barbadian In Labor Force | Age > 16
COMPARE
Immigrants from Croatia
Barbadian
In Labor Force | Age > 16
In Labor Force | Age > 16 Comparison
Immigrants from Croatia
Barbadians
65.0%
IN LABOR FORCE | AGE > 16
35.7/ 100
METRIC RATING
187th/ 347
METRIC RANK
65.0%
IN LABOR FORCE | AGE > 16
33.9/ 100
METRIC RATING
190th/ 347
METRIC RANK
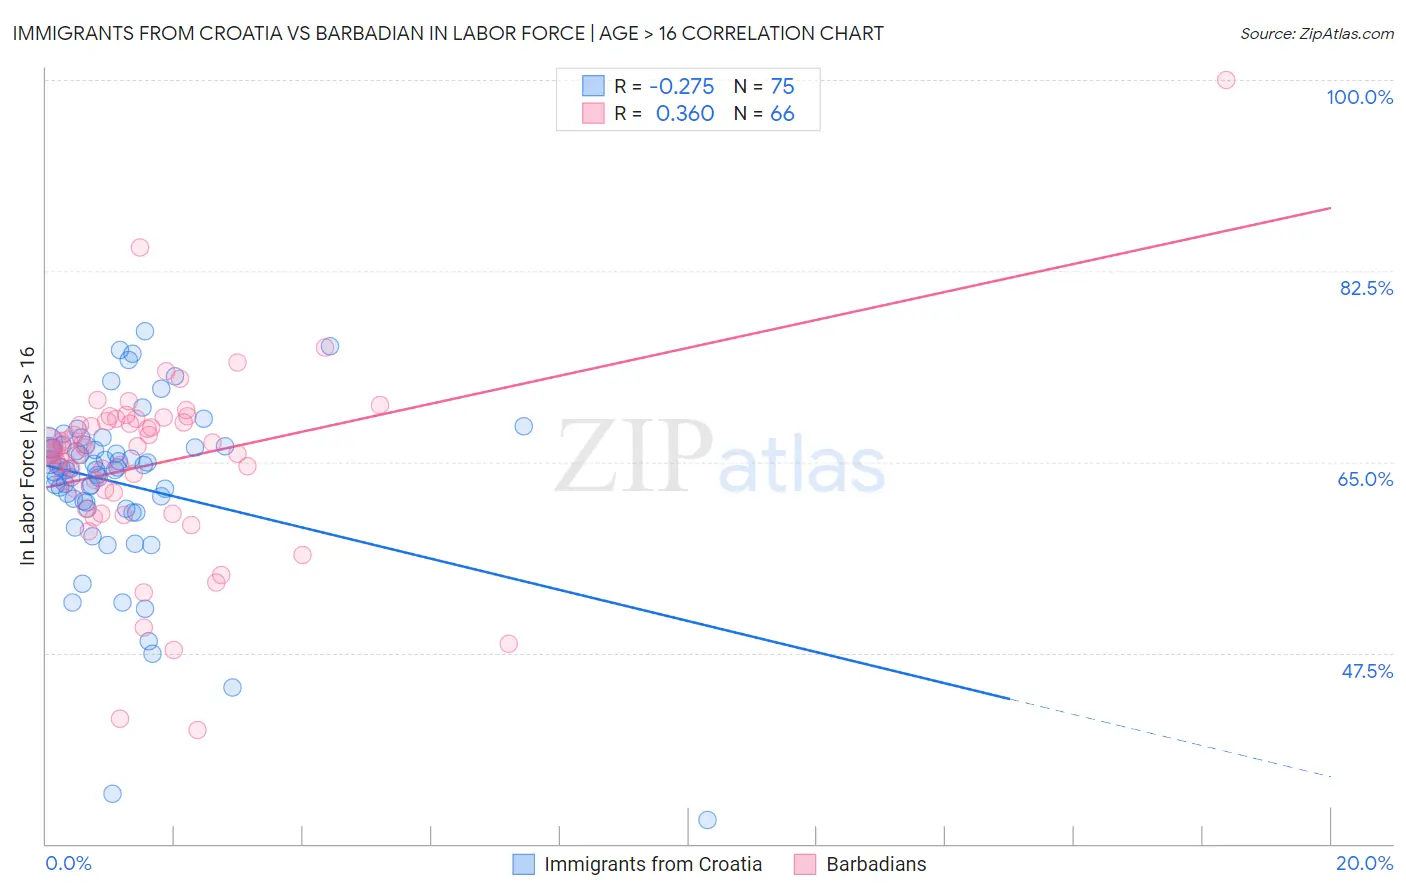
Immigrants from Croatia vs Barbadian In Labor Force | Age > 16 Correlation Chart
The statistical analysis conducted on geographies consisting of 132,563,331 people shows a weak negative correlation between the proportion of Immigrants from Croatia and labor force participation rate among population ages 16 and over in the United States with a correlation coefficient (R) of -0.275 and weighted average of 65.0%. Similarly, the statistical analysis conducted on geographies consisting of 141,304,779 people shows a mild positive correlation between the proportion of Barbadians and labor force participation rate among population ages 16 and over in the United States with a correlation coefficient (R) of 0.360 and weighted average of 65.0%, a difference of 0.020%.
In Labor Force | Age > 16 Correlation Summary
| Measurement | Immigrants from Croatia | Barbadian |
| Minimum | 32.2% | 40.4% |
| Maximum | 77.0% | 100.0% |
| Range | 44.8% | 59.6% |
| Mean | 63.0% | 64.9% |
| Median | 64.4% | 66.1% |
| Interquartile 25% (IQ1) | 61.3% | 62.2% |
| Interquartile 75% (IQ3) | 66.4% | 68.8% |
| Interquartile Range (IQR) | 5.1% | 6.6% |
| Standard Deviation (Sample) | 7.9% | 8.7% |
| Standard Deviation (Population) | 7.8% | 8.6% |
Demographics Similar to Immigrants from Croatia and Barbadians by In Labor Force | Age > 16
In terms of in labor force | age > 16, the demographic groups most similar to Immigrants from Croatia are Immigrants from Portugal (65.0%, a difference of 0.010%), Immigrants from Greece (65.0%, a difference of 0.020%), Scandinavian (65.0%, a difference of 0.020%), Immigrants from Switzerland (65.0%, a difference of 0.030%), and Immigrants from Fiji (65.0%, a difference of 0.030%). Similarly, the demographic groups most similar to Barbadians are Immigrants from Greece (65.0%, a difference of 0.0%), Scandinavian (65.0%, a difference of 0.0%), Immigrants from Fiji (65.0%, a difference of 0.0%), Immigrants from Europe (65.0%, a difference of 0.0%), and Immigrants from Portugal (65.0%, a difference of 0.010%).
| Demographics | Rating | Rank | In Labor Force | Age > 16 |
| Trinidadians and Tobagonians | 45.2 /100 | #178 | Average 65.1% |
| Immigrants | Haiti | 43.3 /100 | #179 | Average 65.1% |
| Immigrants | Latvia | 42.9 /100 | #180 | Average 65.1% |
| Immigrants | Panama | 42.4 /100 | #181 | Average 65.1% |
| Immigrants | Nicaragua | 41.1 /100 | #182 | Average 65.1% |
| Soviet Union | 40.5 /100 | #183 | Average 65.0% |
| Carpatho Rusyns | 40.0 /100 | #184 | Average 65.0% |
| Syrians | 40.0 /100 | #185 | Average 65.0% |
| Immigrants | Switzerland | 38.2 /100 | #186 | Fair 65.0% |
| Immigrants | Croatia | 35.7 /100 | #187 | Fair 65.0% |
| Immigrants | Portugal | 34.8 /100 | #188 | Fair 65.0% |
| Immigrants | Greece | 34.3 /100 | #189 | Fair 65.0% |
| Barbadians | 33.9 /100 | #190 | Fair 65.0% |
| Scandinavians | 33.7 /100 | #191 | Fair 65.0% |
| Immigrants | Fiji | 33.7 /100 | #192 | Fair 65.0% |
| Immigrants | Europe | 33.6 /100 | #193 | Fair 65.0% |
| Immigrants | Southern Europe | 31.3 /100 | #194 | Fair 65.0% |
| Romanians | 31.1 /100 | #195 | Fair 65.0% |
| Haitians | 30.6 /100 | #196 | Fair 65.0% |
| Immigrants | Italy | 28.7 /100 | #197 | Fair 65.0% |
| Greeks | 26.1 /100 | #198 | Fair 64.9% |