Immigrants from Croatia vs Cajun In Labor Force | Age > 16
COMPARE
Immigrants from Croatia
Cajun
In Labor Force | Age > 16
In Labor Force | Age > 16 Comparison
Immigrants from Croatia
Cajuns
65.0%
IN LABOR FORCE | AGE > 16
35.7/ 100
METRIC RATING
187th/ 347
METRIC RANK
61.8%
IN LABOR FORCE | AGE > 16
0.0/ 100
METRIC RATING
327th/ 347
METRIC RANK
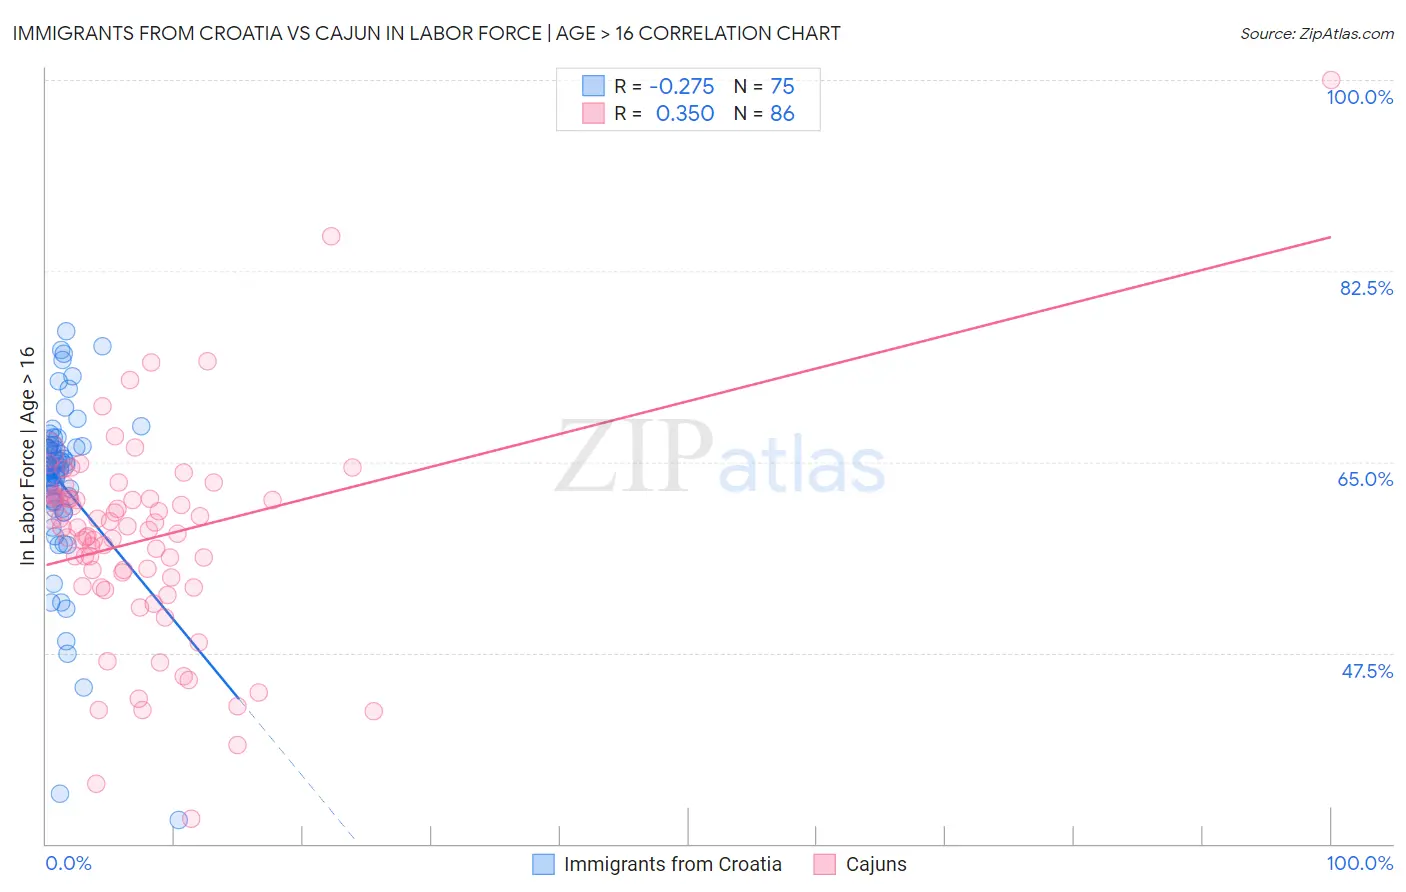
Immigrants from Croatia vs Cajun In Labor Force | Age > 16 Correlation Chart
The statistical analysis conducted on geographies consisting of 132,563,331 people shows a weak negative correlation between the proportion of Immigrants from Croatia and labor force participation rate among population ages 16 and over in the United States with a correlation coefficient (R) of -0.275 and weighted average of 65.0%. Similarly, the statistical analysis conducted on geographies consisting of 149,712,932 people shows a mild positive correlation between the proportion of Cajuns and labor force participation rate among population ages 16 and over in the United States with a correlation coefficient (R) of 0.350 and weighted average of 61.8%, a difference of 5.2%.
In Labor Force | Age > 16 Correlation Summary
| Measurement | Immigrants from Croatia | Cajun |
| Minimum | 32.2% | 32.3% |
| Maximum | 77.0% | 100.0% |
| Range | 44.8% | 67.7% |
| Mean | 63.0% | 57.9% |
| Median | 64.4% | 58.9% |
| Interquartile 25% (IQ1) | 61.3% | 53.6% |
| Interquartile 75% (IQ3) | 66.4% | 61.6% |
| Interquartile Range (IQR) | 5.1% | 8.0% |
| Standard Deviation (Sample) | 7.9% | 9.7% |
| Standard Deviation (Population) | 7.8% | 9.7% |
Similar Demographics by In Labor Force | Age > 16
Demographics Similar to Immigrants from Croatia by In Labor Force | Age > 16
In terms of in labor force | age > 16, the demographic groups most similar to Immigrants from Croatia are Immigrants from Portugal (65.0%, a difference of 0.010%), Immigrants from Greece (65.0%, a difference of 0.020%), Barbadian (65.0%, a difference of 0.020%), Scandinavian (65.0%, a difference of 0.020%), and Immigrants from Switzerland (65.0%, a difference of 0.030%).
| Demographics | Rating | Rank | In Labor Force | Age > 16 |
| Immigrants | Latvia | 42.9 /100 | #180 | Average 65.1% |
| Immigrants | Panama | 42.4 /100 | #181 | Average 65.1% |
| Immigrants | Nicaragua | 41.1 /100 | #182 | Average 65.1% |
| Soviet Union | 40.5 /100 | #183 | Average 65.0% |
| Carpatho Rusyns | 40.0 /100 | #184 | Average 65.0% |
| Syrians | 40.0 /100 | #185 | Average 65.0% |
| Immigrants | Switzerland | 38.2 /100 | #186 | Fair 65.0% |
| Immigrants | Croatia | 35.7 /100 | #187 | Fair 65.0% |
| Immigrants | Portugal | 34.8 /100 | #188 | Fair 65.0% |
| Immigrants | Greece | 34.3 /100 | #189 | Fair 65.0% |
| Barbadians | 33.9 /100 | #190 | Fair 65.0% |
| Scandinavians | 33.7 /100 | #191 | Fair 65.0% |
| Immigrants | Fiji | 33.7 /100 | #192 | Fair 65.0% |
| Immigrants | Europe | 33.6 /100 | #193 | Fair 65.0% |
| Immigrants | Southern Europe | 31.3 /100 | #194 | Fair 65.0% |
Demographics Similar to Cajuns by In Labor Force | Age > 16
In terms of in labor force | age > 16, the demographic groups most similar to Cajuns are Sioux (61.8%, a difference of 0.11%), Dutch West Indian (61.7%, a difference of 0.16%), Cherokee (61.9%, a difference of 0.29%), Cheyenne (62.0%, a difference of 0.34%), and Seminole (62.0%, a difference of 0.38%).
| Demographics | Rating | Rank | In Labor Force | Age > 16 |
| Yakama | 0.0 /100 | #320 | Tragic 62.1% |
| Americans | 0.0 /100 | #321 | Tragic 62.1% |
| Ottawa | 0.0 /100 | #322 | Tragic 62.0% |
| Seminole | 0.0 /100 | #323 | Tragic 62.0% |
| Cheyenne | 0.0 /100 | #324 | Tragic 62.0% |
| Cherokee | 0.0 /100 | #325 | Tragic 61.9% |
| Sioux | 0.0 /100 | #326 | Tragic 61.8% |
| Cajuns | 0.0 /100 | #327 | Tragic 61.8% |
| Dutch West Indians | 0.0 /100 | #328 | Tragic 61.7% |
| Choctaw | 0.0 /100 | #329 | Tragic 61.5% |
| Creek | 0.0 /100 | #330 | Tragic 61.3% |
| Ute | 0.0 /100 | #331 | Tragic 60.9% |
| Crow | 0.0 /100 | #332 | Tragic 60.8% |
| Paiute | 0.0 /100 | #333 | Tragic 60.7% |
| Apache | 0.0 /100 | #334 | Tragic 60.7% |