Immigrants from China vs Immigrants from Congo In Labor Force | Age > 16
COMPARE
Immigrants from China
Immigrants from Congo
In Labor Force | Age > 16
In Labor Force | Age > 16 Comparison
Immigrants from China
Immigrants from Congo
65.4%
IN LABOR FORCE | AGE > 16
80.5/ 100
METRIC RATING
153rd/ 347
METRIC RANK
67.1%
IN LABOR FORCE | AGE > 16
100.0/ 100
METRIC RATING
32nd/ 347
METRIC RANK
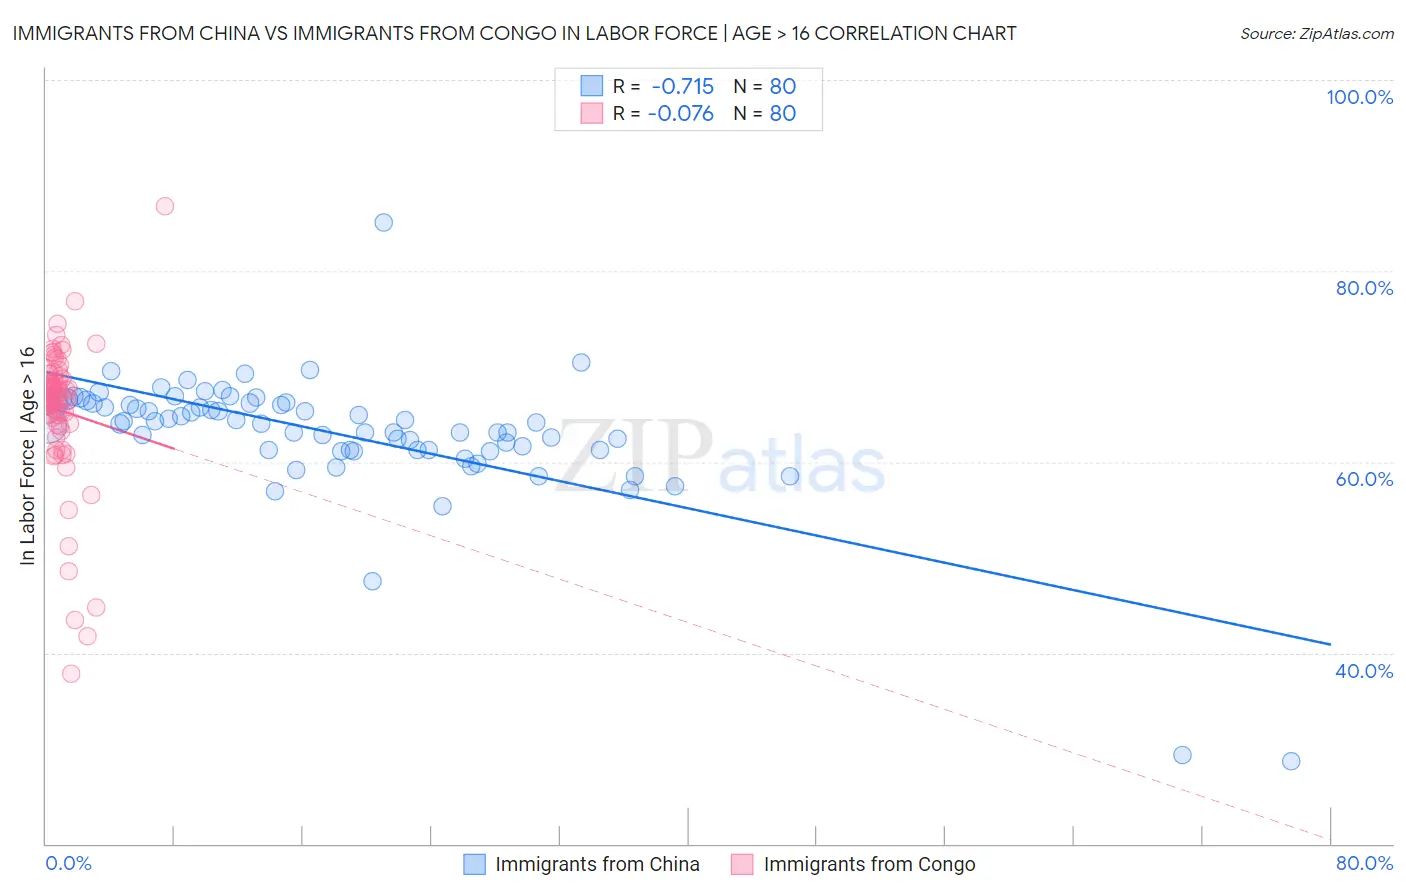
Immigrants from China vs Immigrants from Congo In Labor Force | Age > 16 Correlation Chart
The statistical analysis conducted on geographies consisting of 457,121,912 people shows a strong negative correlation between the proportion of Immigrants from China and labor force participation rate among population ages 16 and over in the United States with a correlation coefficient (R) of -0.715 and weighted average of 65.4%. Similarly, the statistical analysis conducted on geographies consisting of 92,129,705 people shows a slight negative correlation between the proportion of Immigrants from Congo and labor force participation rate among population ages 16 and over in the United States with a correlation coefficient (R) of -0.076 and weighted average of 67.1%, a difference of 2.6%.
In Labor Force | Age > 16 Correlation Summary
| Measurement | Immigrants from China | Immigrants from Congo |
| Minimum | 28.6% | 37.8% |
| Maximum | 85.0% | 86.8% |
| Range | 56.4% | 49.0% |
| Mean | 63.0% | 65.4% |
| Median | 64.1% | 66.8% |
| Interquartile 25% (IQ1) | 61.2% | 64.3% |
| Interquartile 75% (IQ3) | 66.1% | 68.6% |
| Interquartile Range (IQR) | 4.9% | 4.3% |
| Standard Deviation (Sample) | 7.0% | 7.5% |
| Standard Deviation (Population) | 7.0% | 7.4% |
Similar Demographics by In Labor Force | Age > 16
Demographics Similar to Immigrants from China by In Labor Force | Age > 16
In terms of in labor force | age > 16, the demographic groups most similar to Immigrants from China are Yugoslavian (65.4%, a difference of 0.010%), Immigrants (65.4%, a difference of 0.020%), Czech (65.4%, a difference of 0.020%), Immigrants from Eastern Europe (65.4%, a difference of 0.040%), and Immigrants from Armenia (65.3%, a difference of 0.070%).
| Demographics | Rating | Rank | In Labor Force | Age > 16 |
| Cypriots | 88.2 /100 | #146 | Excellent 65.5% |
| Immigrants | Oceania | 87.5 /100 | #147 | Excellent 65.5% |
| Bhutanese | 86.3 /100 | #148 | Excellent 65.5% |
| Immigrants | Albania | 85.7 /100 | #149 | Excellent 65.4% |
| Immigrants | Immigrants | 81.9 /100 | #150 | Excellent 65.4% |
| Czechs | 81.5 /100 | #151 | Excellent 65.4% |
| Yugoslavians | 81.3 /100 | #152 | Excellent 65.4% |
| Immigrants | China | 80.5 /100 | #153 | Excellent 65.4% |
| Immigrants | Eastern Europe | 78.3 /100 | #154 | Good 65.4% |
| Immigrants | Armenia | 76.6 /100 | #155 | Good 65.3% |
| Immigrants | Ireland | 75.9 /100 | #156 | Good 65.3% |
| Immigrants | Russia | 75.7 /100 | #157 | Good 65.3% |
| Panamanians | 75.2 /100 | #158 | Good 65.3% |
| Immigrants | Syria | 74.6 /100 | #159 | Good 65.3% |
| Immigrants | South Africa | 73.5 /100 | #160 | Good 65.3% |
Demographics Similar to Immigrants from Congo by In Labor Force | Age > 16
In terms of in labor force | age > 16, the demographic groups most similar to Immigrants from Congo are Afghan (67.1%, a difference of 0.0%), Immigrants from Ghana (67.1%, a difference of 0.020%), Ghanaian (67.1%, a difference of 0.060%), Immigrants from South Central Asia (67.1%, a difference of 0.070%), and Immigrants from Western Africa (67.1%, a difference of 0.070%).
| Demographics | Rating | Rank | In Labor Force | Age > 16 |
| Immigrants | Africa | 100.0 /100 | #25 | Exceptional 67.4% |
| Immigrants | Cabo Verde | 100.0 /100 | #26 | Exceptional 67.3% |
| Zimbabweans | 100.0 /100 | #27 | Exceptional 67.3% |
| Immigrants | Morocco | 100.0 /100 | #28 | Exceptional 67.2% |
| Thais | 100.0 /100 | #29 | Exceptional 67.2% |
| Immigrants | Zaire | 100.0 /100 | #30 | Exceptional 67.2% |
| Ghanaians | 100.0 /100 | #31 | Exceptional 67.1% |
| Immigrants | Congo | 100.0 /100 | #32 | Exceptional 67.1% |
| Afghans | 100.0 /100 | #33 | Exceptional 67.1% |
| Immigrants | Ghana | 100.0 /100 | #34 | Exceptional 67.1% |
| Immigrants | South Central Asia | 100.0 /100 | #35 | Exceptional 67.1% |
| Immigrants | Western Africa | 100.0 /100 | #36 | Exceptional 67.1% |
| Immigrants | Afghanistan | 100.0 /100 | #37 | Exceptional 67.0% |
| Immigrants | Nigeria | 100.0 /100 | #38 | Exceptional 66.9% |
| Salvadorans | 100.0 /100 | #39 | Exceptional 66.8% |