Immigrants from China vs Inupiat In Labor Force | Age > 16
COMPARE
Immigrants from China
Inupiat
In Labor Force | Age > 16
In Labor Force | Age > 16 Comparison
Immigrants from China
Inupiat
65.4%
IN LABOR FORCE | AGE > 16
80.5/ 100
METRIC RATING
153rd/ 347
METRIC RANK
64.3%
IN LABOR FORCE | AGE > 16
0.8/ 100
METRIC RATING
257th/ 347
METRIC RANK
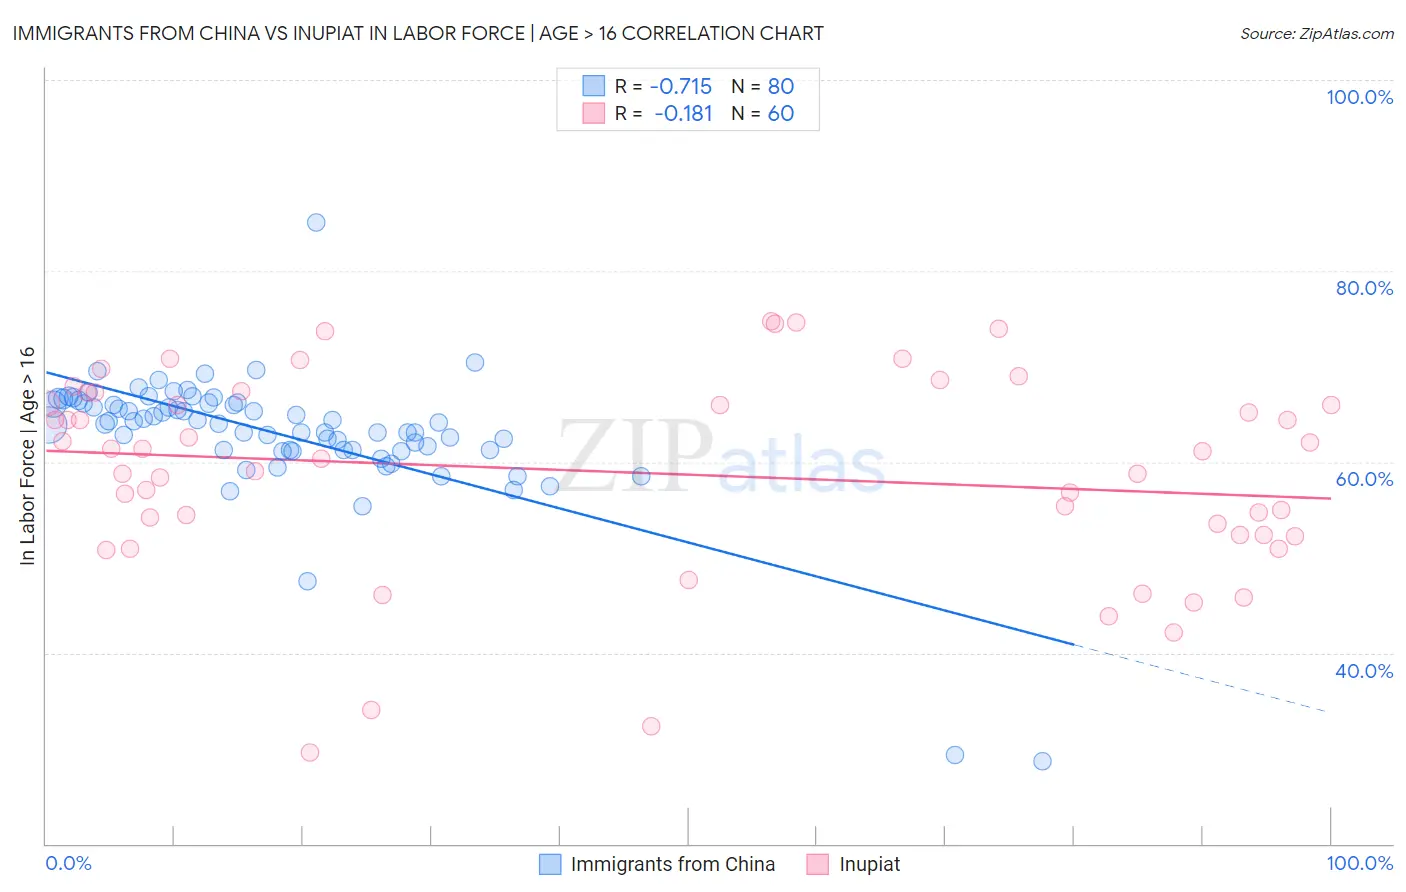
Immigrants from China vs Inupiat In Labor Force | Age > 16 Correlation Chart
The statistical analysis conducted on geographies consisting of 457,121,912 people shows a strong negative correlation between the proportion of Immigrants from China and labor force participation rate among population ages 16 and over in the United States with a correlation coefficient (R) of -0.715 and weighted average of 65.4%. Similarly, the statistical analysis conducted on geographies consisting of 96,350,429 people shows a poor negative correlation between the proportion of Inupiat and labor force participation rate among population ages 16 and over in the United States with a correlation coefficient (R) of -0.181 and weighted average of 64.3%, a difference of 1.8%.
In Labor Force | Age > 16 Correlation Summary
| Measurement | Immigrants from China | Inupiat |
| Minimum | 28.6% | 29.5% |
| Maximum | 85.0% | 74.7% |
| Range | 56.4% | 45.2% |
| Mean | 63.0% | 58.9% |
| Median | 64.1% | 60.7% |
| Interquartile 25% (IQ1) | 61.2% | 52.3% |
| Interquartile 75% (IQ3) | 66.1% | 66.6% |
| Interquartile Range (IQR) | 4.9% | 14.3% |
| Standard Deviation (Sample) | 7.0% | 10.6% |
| Standard Deviation (Population) | 7.0% | 10.5% |
Similar Demographics by In Labor Force | Age > 16
Demographics Similar to Immigrants from China by In Labor Force | Age > 16
In terms of in labor force | age > 16, the demographic groups most similar to Immigrants from China are Yugoslavian (65.4%, a difference of 0.010%), Immigrants (65.4%, a difference of 0.020%), Czech (65.4%, a difference of 0.020%), Immigrants from Eastern Europe (65.4%, a difference of 0.040%), and Immigrants from Armenia (65.3%, a difference of 0.070%).
| Demographics | Rating | Rank | In Labor Force | Age > 16 |
| Cypriots | 88.2 /100 | #146 | Excellent 65.5% |
| Immigrants | Oceania | 87.5 /100 | #147 | Excellent 65.5% |
| Bhutanese | 86.3 /100 | #148 | Excellent 65.5% |
| Immigrants | Albania | 85.7 /100 | #149 | Excellent 65.4% |
| Immigrants | Immigrants | 81.9 /100 | #150 | Excellent 65.4% |
| Czechs | 81.5 /100 | #151 | Excellent 65.4% |
| Yugoslavians | 81.3 /100 | #152 | Excellent 65.4% |
| Immigrants | China | 80.5 /100 | #153 | Excellent 65.4% |
| Immigrants | Eastern Europe | 78.3 /100 | #154 | Good 65.4% |
| Immigrants | Armenia | 76.6 /100 | #155 | Good 65.3% |
| Immigrants | Ireland | 75.9 /100 | #156 | Good 65.3% |
| Immigrants | Russia | 75.7 /100 | #157 | Good 65.3% |
| Panamanians | 75.2 /100 | #158 | Good 65.3% |
| Immigrants | Syria | 74.6 /100 | #159 | Good 65.3% |
| Immigrants | South Africa | 73.5 /100 | #160 | Good 65.3% |
Demographics Similar to Inupiat by In Labor Force | Age > 16
In terms of in labor force | age > 16, the demographic groups most similar to Inupiat are Immigrants from Scotland (64.2%, a difference of 0.020%), Immigrants from Mexico (64.3%, a difference of 0.040%), Immigrants from Western Europe (64.2%, a difference of 0.050%), Marshallese (64.2%, a difference of 0.060%), and Basque (64.2%, a difference of 0.060%).
| Demographics | Rating | Rank | In Labor Force | Age > 16 |
| British West Indians | 1.8 /100 | #250 | Tragic 64.4% |
| Portuguese | 1.6 /100 | #251 | Tragic 64.4% |
| Immigrants | Dominican Republic | 1.5 /100 | #252 | Tragic 64.4% |
| Czechoslovakians | 1.4 /100 | #253 | Tragic 64.3% |
| Immigrants | Uzbekistan | 1.4 /100 | #254 | Tragic 64.3% |
| Hispanics or Latinos | 1.1 /100 | #255 | Tragic 64.3% |
| Immigrants | Mexico | 1.0 /100 | #256 | Tragic 64.3% |
| Inupiat | 0.8 /100 | #257 | Tragic 64.3% |
| Immigrants | Scotland | 0.8 /100 | #258 | Tragic 64.2% |
| Immigrants | Western Europe | 0.7 /100 | #259 | Tragic 64.2% |
| Marshallese | 0.7 /100 | #260 | Tragic 64.2% |
| Basques | 0.7 /100 | #261 | Tragic 64.2% |
| Finns | 0.7 /100 | #262 | Tragic 64.2% |
| Bahamians | 0.6 /100 | #263 | Tragic 64.2% |
| Dutch | 0.6 /100 | #264 | Tragic 64.2% |