Puerto Rican vs Immigrants from Congo In Labor Force | Age > 16
COMPARE
Puerto Rican
Immigrants from Congo
In Labor Force | Age > 16
In Labor Force | Age > 16 Comparison
Puerto Ricans
Immigrants from Congo
58.1%
IN LABOR FORCE | AGE > 16
0.0/ 100
METRIC RATING
342nd/ 347
METRIC RANK
67.1%
IN LABOR FORCE | AGE > 16
100.0/ 100
METRIC RATING
32nd/ 347
METRIC RANK
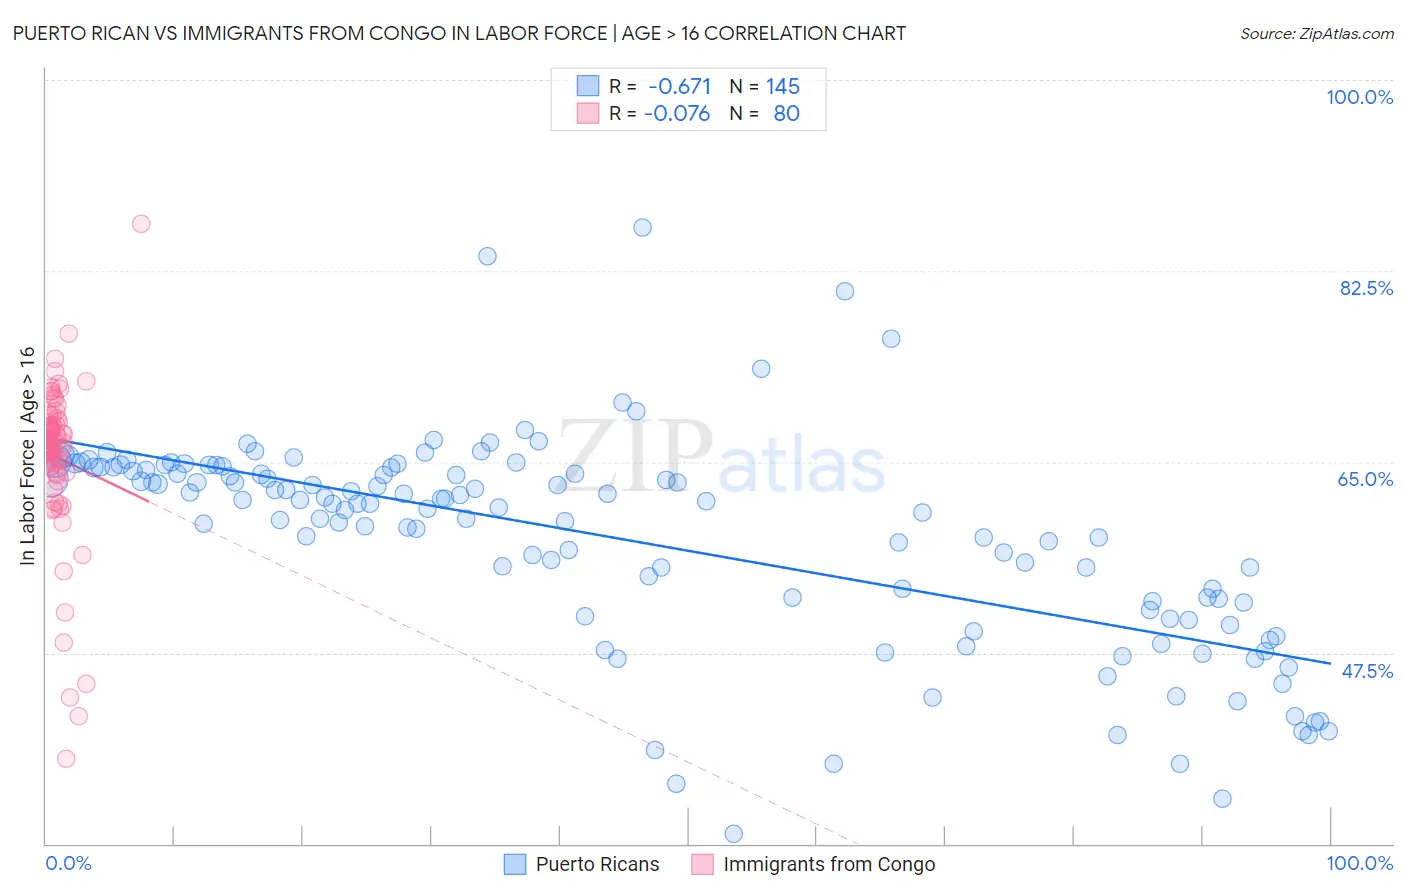
Puerto Rican vs Immigrants from Congo In Labor Force | Age > 16 Correlation Chart
The statistical analysis conducted on geographies consisting of 528,299,719 people shows a significant negative correlation between the proportion of Puerto Ricans and labor force participation rate among population ages 16 and over in the United States with a correlation coefficient (R) of -0.671 and weighted average of 58.1%. Similarly, the statistical analysis conducted on geographies consisting of 92,129,705 people shows a slight negative correlation between the proportion of Immigrants from Congo and labor force participation rate among population ages 16 and over in the United States with a correlation coefficient (R) of -0.076 and weighted average of 67.1%, a difference of 15.5%.
In Labor Force | Age > 16 Correlation Summary
| Measurement | Puerto Rican | Immigrants from Congo |
| Minimum | 30.9% | 37.8% |
| Maximum | 86.5% | 86.8% |
| Range | 55.6% | 49.0% |
| Mean | 58.0% | 65.4% |
| Median | 61.1% | 66.8% |
| Interquartile 25% (IQ1) | 51.7% | 64.3% |
| Interquartile 75% (IQ3) | 64.5% | 68.6% |
| Interquartile Range (IQR) | 12.8% | 4.3% |
| Standard Deviation (Sample) | 9.7% | 7.5% |
| Standard Deviation (Population) | 9.6% | 7.4% |
Similar Demographics by In Labor Force | Age > 16
Demographics Similar to Puerto Ricans by In Labor Force | Age > 16
In terms of in labor force | age > 16, the demographic groups most similar to Puerto Ricans are Hopi (58.4%, a difference of 0.47%), Yuman (57.8%, a difference of 0.52%), Pima (57.4%, a difference of 1.2%), Tohono O'odham (57.2%, a difference of 1.5%), and Pueblo (59.3%, a difference of 2.0%).
| Demographics | Rating | Rank | In Labor Force | Age > 16 |
| Paiute | 0.0 /100 | #333 | Tragic 60.7% |
| Apache | 0.0 /100 | #334 | Tragic 60.7% |
| Natives/Alaskans | 0.0 /100 | #335 | Tragic 60.6% |
| Menominee | 0.0 /100 | #336 | Tragic 60.6% |
| Colville | 0.0 /100 | #337 | Tragic 59.8% |
| Immigrants | Yemen | 0.0 /100 | #338 | Tragic 59.6% |
| Houma | 0.0 /100 | #339 | Tragic 59.5% |
| Pueblo | 0.0 /100 | #340 | Tragic 59.3% |
| Hopi | 0.0 /100 | #341 | Tragic 58.4% |
| Puerto Ricans | 0.0 /100 | #342 | Tragic 58.1% |
| Yuman | 0.0 /100 | #343 | Tragic 57.8% |
| Pima | 0.0 /100 | #344 | Tragic 57.4% |
| Tohono O'odham | 0.0 /100 | #345 | Tragic 57.2% |
| Lumbee | 0.0 /100 | #346 | Tragic 56.8% |
| Navajo | 0.0 /100 | #347 | Tragic 56.6% |
Demographics Similar to Immigrants from Congo by In Labor Force | Age > 16
In terms of in labor force | age > 16, the demographic groups most similar to Immigrants from Congo are Afghan (67.1%, a difference of 0.0%), Immigrants from Ghana (67.1%, a difference of 0.020%), Ghanaian (67.1%, a difference of 0.060%), Immigrants from South Central Asia (67.1%, a difference of 0.070%), and Immigrants from Western Africa (67.1%, a difference of 0.070%).
| Demographics | Rating | Rank | In Labor Force | Age > 16 |
| Immigrants | Africa | 100.0 /100 | #25 | Exceptional 67.4% |
| Immigrants | Cabo Verde | 100.0 /100 | #26 | Exceptional 67.3% |
| Zimbabweans | 100.0 /100 | #27 | Exceptional 67.3% |
| Immigrants | Morocco | 100.0 /100 | #28 | Exceptional 67.2% |
| Thais | 100.0 /100 | #29 | Exceptional 67.2% |
| Immigrants | Zaire | 100.0 /100 | #30 | Exceptional 67.2% |
| Ghanaians | 100.0 /100 | #31 | Exceptional 67.1% |
| Immigrants | Congo | 100.0 /100 | #32 | Exceptional 67.1% |
| Afghans | 100.0 /100 | #33 | Exceptional 67.1% |
| Immigrants | Ghana | 100.0 /100 | #34 | Exceptional 67.1% |
| Immigrants | South Central Asia | 100.0 /100 | #35 | Exceptional 67.1% |
| Immigrants | Western Africa | 100.0 /100 | #36 | Exceptional 67.1% |
| Immigrants | Afghanistan | 100.0 /100 | #37 | Exceptional 67.0% |
| Immigrants | Nigeria | 100.0 /100 | #38 | Exceptional 66.9% |
| Salvadorans | 100.0 /100 | #39 | Exceptional 66.8% |