Immigrants from China vs Immigrants from France In Labor Force | Age > 16
COMPARE
Immigrants from China
Immigrants from France
In Labor Force | Age > 16
In Labor Force | Age > 16 Comparison
Immigrants from China
Immigrants from France
65.4%
IN LABOR FORCE | AGE > 16
80.5/ 100
METRIC RATING
153rd/ 347
METRIC RANK
65.7%
IN LABOR FORCE | AGE > 16
96.4/ 100
METRIC RATING
119th/ 347
METRIC RANK
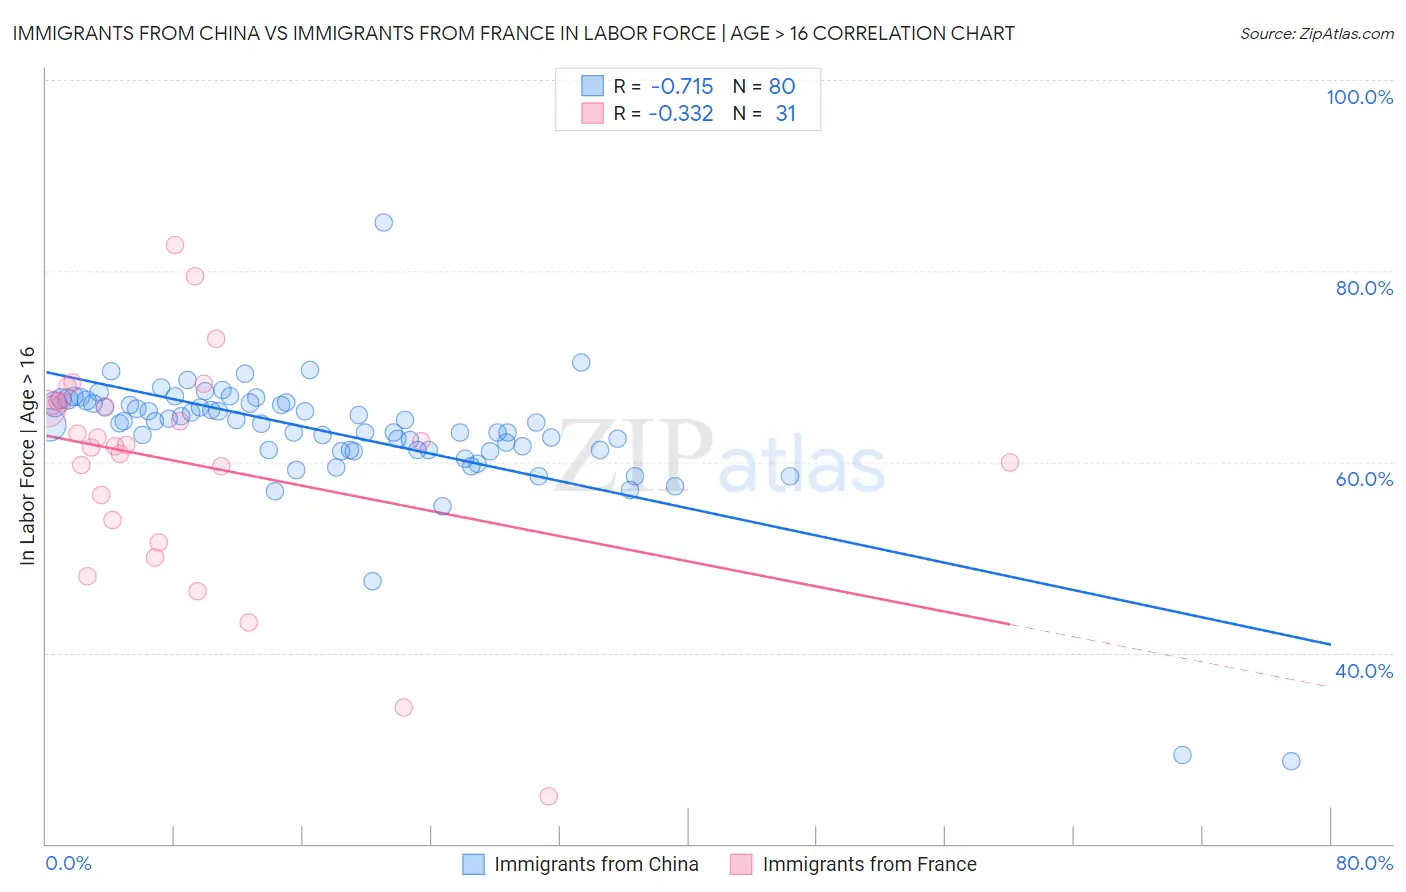
Immigrants from China vs Immigrants from France In Labor Force | Age > 16 Correlation Chart
The statistical analysis conducted on geographies consisting of 457,121,912 people shows a strong negative correlation between the proportion of Immigrants from China and labor force participation rate among population ages 16 and over in the United States with a correlation coefficient (R) of -0.715 and weighted average of 65.4%. Similarly, the statistical analysis conducted on geographies consisting of 287,921,196 people shows a mild negative correlation between the proportion of Immigrants from France and labor force participation rate among population ages 16 and over in the United States with a correlation coefficient (R) of -0.332 and weighted average of 65.7%, a difference of 0.52%.
In Labor Force | Age > 16 Correlation Summary
| Measurement | Immigrants from China | Immigrants from France |
| Minimum | 28.6% | 25.0% |
| Maximum | 85.0% | 82.7% |
| Range | 56.4% | 57.7% |
| Mean | 63.0% | 59.9% |
| Median | 64.1% | 61.8% |
| Interquartile 25% (IQ1) | 61.2% | 53.9% |
| Interquartile 75% (IQ3) | 66.1% | 66.3% |
| Interquartile Range (IQR) | 4.9% | 12.4% |
| Standard Deviation (Sample) | 7.0% | 11.8% |
| Standard Deviation (Population) | 7.0% | 11.6% |
Similar Demographics by In Labor Force | Age > 16
Demographics Similar to Immigrants from China by In Labor Force | Age > 16
In terms of in labor force | age > 16, the demographic groups most similar to Immigrants from China are Yugoslavian (65.4%, a difference of 0.010%), Immigrants (65.4%, a difference of 0.020%), Czech (65.4%, a difference of 0.020%), Immigrants from Eastern Europe (65.4%, a difference of 0.040%), and Immigrants from Armenia (65.3%, a difference of 0.070%).
| Demographics | Rating | Rank | In Labor Force | Age > 16 |
| Cypriots | 88.2 /100 | #146 | Excellent 65.5% |
| Immigrants | Oceania | 87.5 /100 | #147 | Excellent 65.5% |
| Bhutanese | 86.3 /100 | #148 | Excellent 65.5% |
| Immigrants | Albania | 85.7 /100 | #149 | Excellent 65.4% |
| Immigrants | Immigrants | 81.9 /100 | #150 | Excellent 65.4% |
| Czechs | 81.5 /100 | #151 | Excellent 65.4% |
| Yugoslavians | 81.3 /100 | #152 | Excellent 65.4% |
| Immigrants | China | 80.5 /100 | #153 | Excellent 65.4% |
| Immigrants | Eastern Europe | 78.3 /100 | #154 | Good 65.4% |
| Immigrants | Armenia | 76.6 /100 | #155 | Good 65.3% |
| Immigrants | Ireland | 75.9 /100 | #156 | Good 65.3% |
| Immigrants | Russia | 75.7 /100 | #157 | Good 65.3% |
| Panamanians | 75.2 /100 | #158 | Good 65.3% |
| Immigrants | Syria | 74.6 /100 | #159 | Good 65.3% |
| Immigrants | South Africa | 73.5 /100 | #160 | Good 65.3% |
Demographics Similar to Immigrants from France by In Labor Force | Age > 16
In terms of in labor force | age > 16, the demographic groups most similar to Immigrants from France are Immigrants from Iran (65.7%, a difference of 0.010%), Immigrants from Thailand (65.7%, a difference of 0.010%), Argentinean (65.7%, a difference of 0.020%), Immigrants from Hong Kong (65.7%, a difference of 0.020%), and Immigrants from Indonesia (65.7%, a difference of 0.030%).
| Demographics | Rating | Rank | In Labor Force | Age > 16 |
| Laotians | 97.4 /100 | #112 | Exceptional 65.8% |
| Pakistanis | 97.1 /100 | #113 | Exceptional 65.8% |
| Hondurans | 97.1 /100 | #114 | Exceptional 65.8% |
| Immigrants | Indonesia | 96.8 /100 | #115 | Exceptional 65.7% |
| Argentineans | 96.7 /100 | #116 | Exceptional 65.7% |
| Immigrants | Iran | 96.6 /100 | #117 | Exceptional 65.7% |
| Immigrants | Thailand | 96.6 /100 | #118 | Exceptional 65.7% |
| Immigrants | France | 96.4 /100 | #119 | Exceptional 65.7% |
| Immigrants | Hong Kong | 96.2 /100 | #120 | Exceptional 65.7% |
| New Zealanders | 96.0 /100 | #121 | Exceptional 65.7% |
| Immigrants | Ecuador | 95.9 /100 | #122 | Exceptional 65.7% |
| Immigrants | Iraq | 95.5 /100 | #123 | Exceptional 65.7% |
| Iraqis | 95.4 /100 | #124 | Exceptional 65.7% |
| Norwegians | 95.3 /100 | #125 | Exceptional 65.7% |
| Koreans | 95.3 /100 | #126 | Exceptional 65.7% |