Scandinavian vs Immigrants from Congo In Labor Force | Age > 16
COMPARE
Scandinavian
Immigrants from Congo
In Labor Force | Age > 16
In Labor Force | Age > 16 Comparison
Scandinavians
Immigrants from Congo
65.0%
IN LABOR FORCE | AGE > 16
33.7/ 100
METRIC RATING
191st/ 347
METRIC RANK
67.1%
IN LABOR FORCE | AGE > 16
100.0/ 100
METRIC RATING
32nd/ 347
METRIC RANK
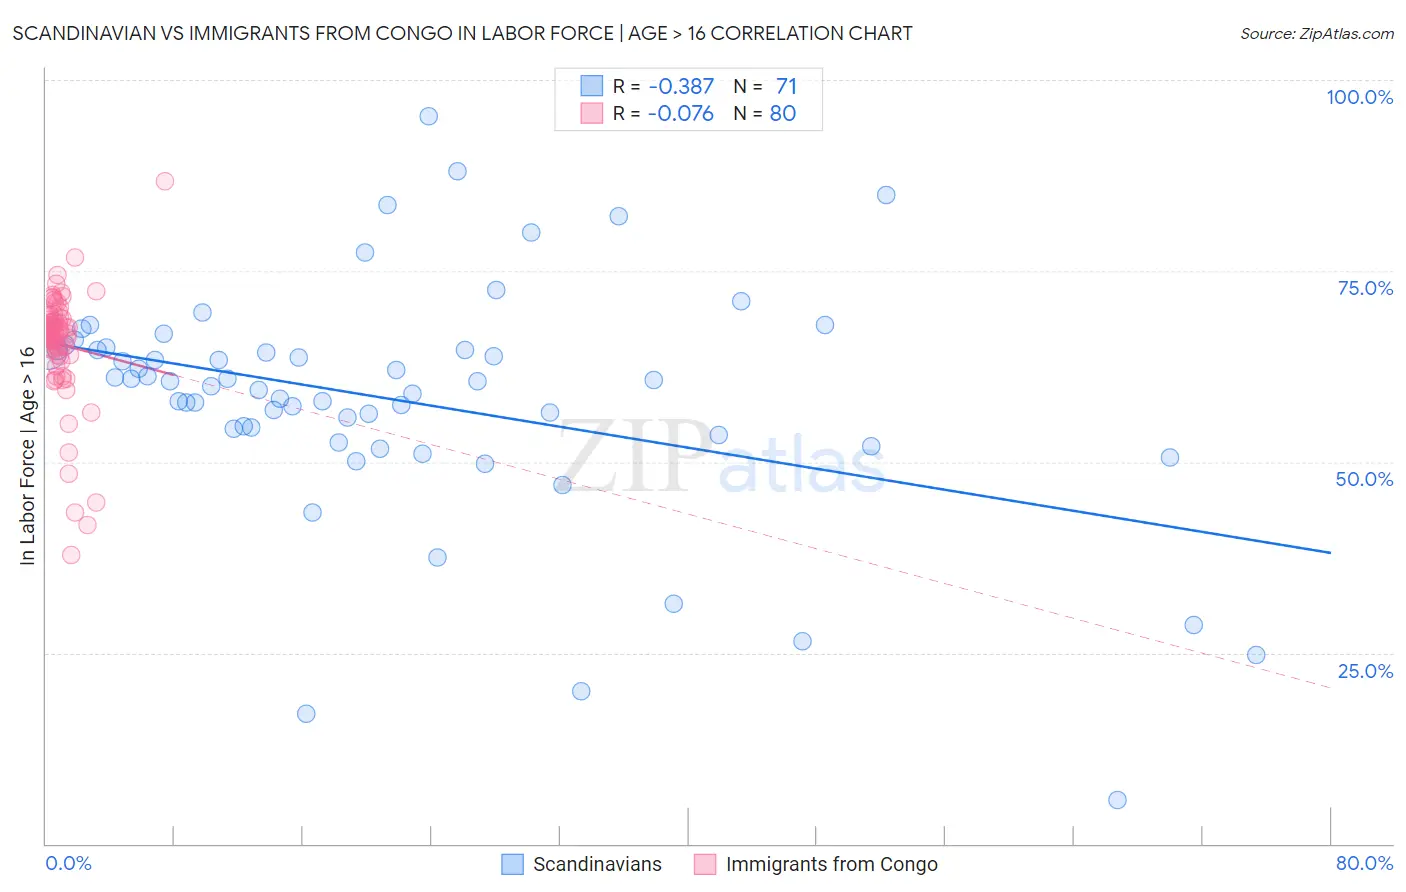
Scandinavian vs Immigrants from Congo In Labor Force | Age > 16 Correlation Chart
The statistical analysis conducted on geographies consisting of 472,640,226 people shows a mild negative correlation between the proportion of Scandinavians and labor force participation rate among population ages 16 and over in the United States with a correlation coefficient (R) of -0.387 and weighted average of 65.0%. Similarly, the statistical analysis conducted on geographies consisting of 92,129,705 people shows a slight negative correlation between the proportion of Immigrants from Congo and labor force participation rate among population ages 16 and over in the United States with a correlation coefficient (R) of -0.076 and weighted average of 67.1%, a difference of 3.2%.
In Labor Force | Age > 16 Correlation Summary
| Measurement | Scandinavian | Immigrants from Congo |
| Minimum | 5.7% | 37.8% |
| Maximum | 95.2% | 86.8% |
| Range | 89.5% | 49.0% |
| Mean | 58.1% | 65.4% |
| Median | 60.5% | 66.8% |
| Interquartile 25% (IQ1) | 53.6% | 64.3% |
| Interquartile 75% (IQ3) | 64.7% | 68.6% |
| Interquartile Range (IQR) | 11.1% | 4.3% |
| Standard Deviation (Sample) | 15.7% | 7.5% |
| Standard Deviation (Population) | 15.6% | 7.4% |
Similar Demographics by In Labor Force | Age > 16
Demographics Similar to Scandinavians by In Labor Force | Age > 16
In terms of in labor force | age > 16, the demographic groups most similar to Scandinavians are Barbadian (65.0%, a difference of 0.0%), Immigrants from Fiji (65.0%, a difference of 0.0%), Immigrants from Europe (65.0%, a difference of 0.0%), Immigrants from Portugal (65.0%, a difference of 0.010%), and Immigrants from Greece (65.0%, a difference of 0.010%).
| Demographics | Rating | Rank | In Labor Force | Age > 16 |
| Carpatho Rusyns | 40.0 /100 | #184 | Average 65.0% |
| Syrians | 40.0 /100 | #185 | Average 65.0% |
| Immigrants | Switzerland | 38.2 /100 | #186 | Fair 65.0% |
| Immigrants | Croatia | 35.7 /100 | #187 | Fair 65.0% |
| Immigrants | Portugal | 34.8 /100 | #188 | Fair 65.0% |
| Immigrants | Greece | 34.3 /100 | #189 | Fair 65.0% |
| Barbadians | 33.9 /100 | #190 | Fair 65.0% |
| Scandinavians | 33.7 /100 | #191 | Fair 65.0% |
| Immigrants | Fiji | 33.7 /100 | #192 | Fair 65.0% |
| Immigrants | Europe | 33.6 /100 | #193 | Fair 65.0% |
| Immigrants | Southern Europe | 31.3 /100 | #194 | Fair 65.0% |
| Romanians | 31.1 /100 | #195 | Fair 65.0% |
| Haitians | 30.6 /100 | #196 | Fair 65.0% |
| Immigrants | Italy | 28.7 /100 | #197 | Fair 65.0% |
| Greeks | 26.1 /100 | #198 | Fair 64.9% |
Demographics Similar to Immigrants from Congo by In Labor Force | Age > 16
In terms of in labor force | age > 16, the demographic groups most similar to Immigrants from Congo are Afghan (67.1%, a difference of 0.0%), Immigrants from Ghana (67.1%, a difference of 0.020%), Ghanaian (67.1%, a difference of 0.060%), Immigrants from South Central Asia (67.1%, a difference of 0.070%), and Immigrants from Western Africa (67.1%, a difference of 0.070%).
| Demographics | Rating | Rank | In Labor Force | Age > 16 |
| Immigrants | Africa | 100.0 /100 | #25 | Exceptional 67.4% |
| Immigrants | Cabo Verde | 100.0 /100 | #26 | Exceptional 67.3% |
| Zimbabweans | 100.0 /100 | #27 | Exceptional 67.3% |
| Immigrants | Morocco | 100.0 /100 | #28 | Exceptional 67.2% |
| Thais | 100.0 /100 | #29 | Exceptional 67.2% |
| Immigrants | Zaire | 100.0 /100 | #30 | Exceptional 67.2% |
| Ghanaians | 100.0 /100 | #31 | Exceptional 67.1% |
| Immigrants | Congo | 100.0 /100 | #32 | Exceptional 67.1% |
| Afghans | 100.0 /100 | #33 | Exceptional 67.1% |
| Immigrants | Ghana | 100.0 /100 | #34 | Exceptional 67.1% |
| Immigrants | South Central Asia | 100.0 /100 | #35 | Exceptional 67.1% |
| Immigrants | Western Africa | 100.0 /100 | #36 | Exceptional 67.1% |
| Immigrants | Afghanistan | 100.0 /100 | #37 | Exceptional 67.0% |
| Immigrants | Nigeria | 100.0 /100 | #38 | Exceptional 66.9% |
| Salvadorans | 100.0 /100 | #39 | Exceptional 66.8% |