Immigrants from China vs Immigrants from Western Asia In Labor Force | Age > 16
COMPARE
Immigrants from China
Immigrants from Western Asia
In Labor Force | Age > 16
In Labor Force | Age > 16 Comparison
Immigrants from China
Immigrants from Western Asia
65.4%
IN LABOR FORCE | AGE > 16
80.5/ 100
METRIC RATING
153rd/ 347
METRIC RANK
65.3%
IN LABOR FORCE | AGE > 16
67.3/ 100
METRIC RATING
166th/ 347
METRIC RANK
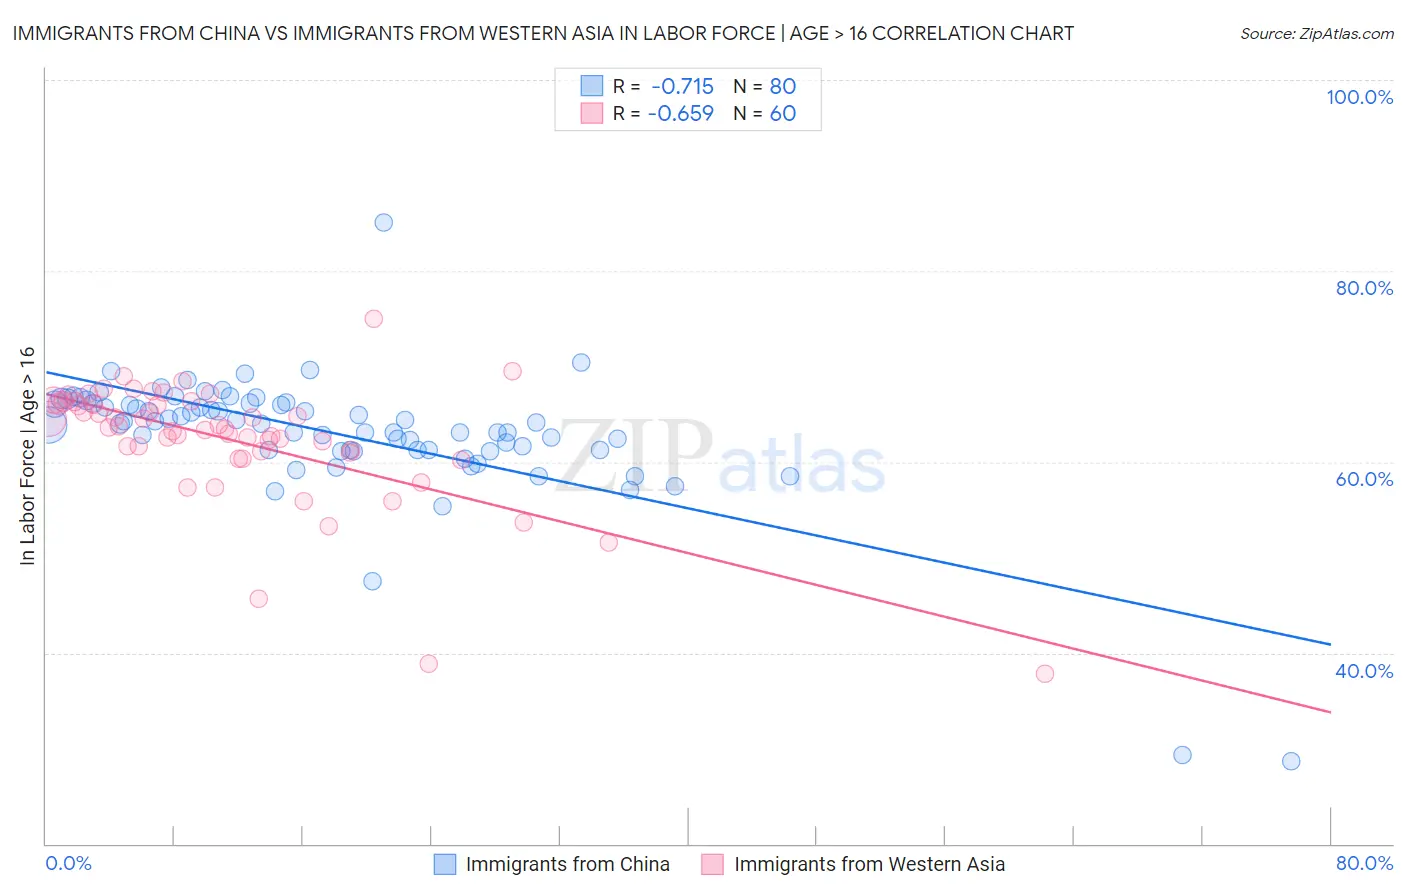
Immigrants from China vs Immigrants from Western Asia In Labor Force | Age > 16 Correlation Chart
The statistical analysis conducted on geographies consisting of 457,121,912 people shows a strong negative correlation between the proportion of Immigrants from China and labor force participation rate among population ages 16 and over in the United States with a correlation coefficient (R) of -0.715 and weighted average of 65.4%. Similarly, the statistical analysis conducted on geographies consisting of 404,444,876 people shows a significant negative correlation between the proportion of Immigrants from Western Asia and labor force participation rate among population ages 16 and over in the United States with a correlation coefficient (R) of -0.659 and weighted average of 65.3%, a difference of 0.19%.
In Labor Force | Age > 16 Correlation Summary
| Measurement | Immigrants from China | Immigrants from Western Asia |
| Minimum | 28.6% | 37.8% |
| Maximum | 85.0% | 75.0% |
| Range | 56.4% | 37.2% |
| Mean | 63.0% | 62.3% |
| Median | 64.1% | 63.6% |
| Interquartile 25% (IQ1) | 61.2% | 61.0% |
| Interquartile 75% (IQ3) | 66.1% | 66.2% |
| Interquartile Range (IQR) | 4.9% | 5.2% |
| Standard Deviation (Sample) | 7.0% | 6.5% |
| Standard Deviation (Population) | 7.0% | 6.5% |
Demographics Similar to Immigrants from China and Immigrants from Western Asia by In Labor Force | Age > 16
In terms of in labor force | age > 16, the demographic groups most similar to Immigrants from China are Yugoslavian (65.4%, a difference of 0.010%), Immigrants (65.4%, a difference of 0.020%), Czech (65.4%, a difference of 0.020%), Immigrants from Eastern Europe (65.4%, a difference of 0.040%), and Immigrants from Armenia (65.3%, a difference of 0.070%). Similarly, the demographic groups most similar to Immigrants from Western Asia are Immigrants from Kazakhstan (65.3%, a difference of 0.010%), Danish (65.3%, a difference of 0.020%), Immigrants from Belarus (65.2%, a difference of 0.020%), South African (65.3%, a difference of 0.030%), and Australian (65.3%, a difference of 0.050%).
| Demographics | Rating | Rank | In Labor Force | Age > 16 |
| Immigrants | Albania | 85.7 /100 | #149 | Excellent 65.4% |
| Immigrants | Immigrants | 81.9 /100 | #150 | Excellent 65.4% |
| Czechs | 81.5 /100 | #151 | Excellent 65.4% |
| Yugoslavians | 81.3 /100 | #152 | Excellent 65.4% |
| Immigrants | China | 80.5 /100 | #153 | Excellent 65.4% |
| Immigrants | Eastern Europe | 78.3 /100 | #154 | Good 65.4% |
| Immigrants | Armenia | 76.6 /100 | #155 | Good 65.3% |
| Immigrants | Ireland | 75.9 /100 | #156 | Good 65.3% |
| Immigrants | Russia | 75.7 /100 | #157 | Good 65.3% |
| Panamanians | 75.2 /100 | #158 | Good 65.3% |
| Immigrants | Syria | 74.6 /100 | #159 | Good 65.3% |
| Immigrants | South Africa | 73.5 /100 | #160 | Good 65.3% |
| Australians | 71.3 /100 | #161 | Good 65.3% |
| Albanians | 70.8 /100 | #162 | Good 65.3% |
| South Africans | 69.8 /100 | #163 | Good 65.3% |
| Danes | 68.8 /100 | #164 | Good 65.3% |
| Immigrants | Kazakhstan | 68.1 /100 | #165 | Good 65.3% |
| Immigrants | Western Asia | 67.3 /100 | #166 | Good 65.3% |
| Immigrants | Belarus | 66.0 /100 | #167 | Good 65.2% |
| Serbians | 63.5 /100 | #168 | Good 65.2% |
| Arabs | 62.4 /100 | #169 | Good 65.2% |