Immigrants from Czechoslovakia vs Immigrants from Congo In Labor Force | Age > 16
COMPARE
Immigrants from Czechoslovakia
Immigrants from Congo
In Labor Force | Age > 16
In Labor Force | Age > 16 Comparison
Immigrants from Czechoslovakia
Immigrants from Congo
64.8%
IN LABOR FORCE | AGE > 16
12.3/ 100
METRIC RATING
215th/ 347
METRIC RANK
67.1%
IN LABOR FORCE | AGE > 16
100.0/ 100
METRIC RATING
32nd/ 347
METRIC RANK
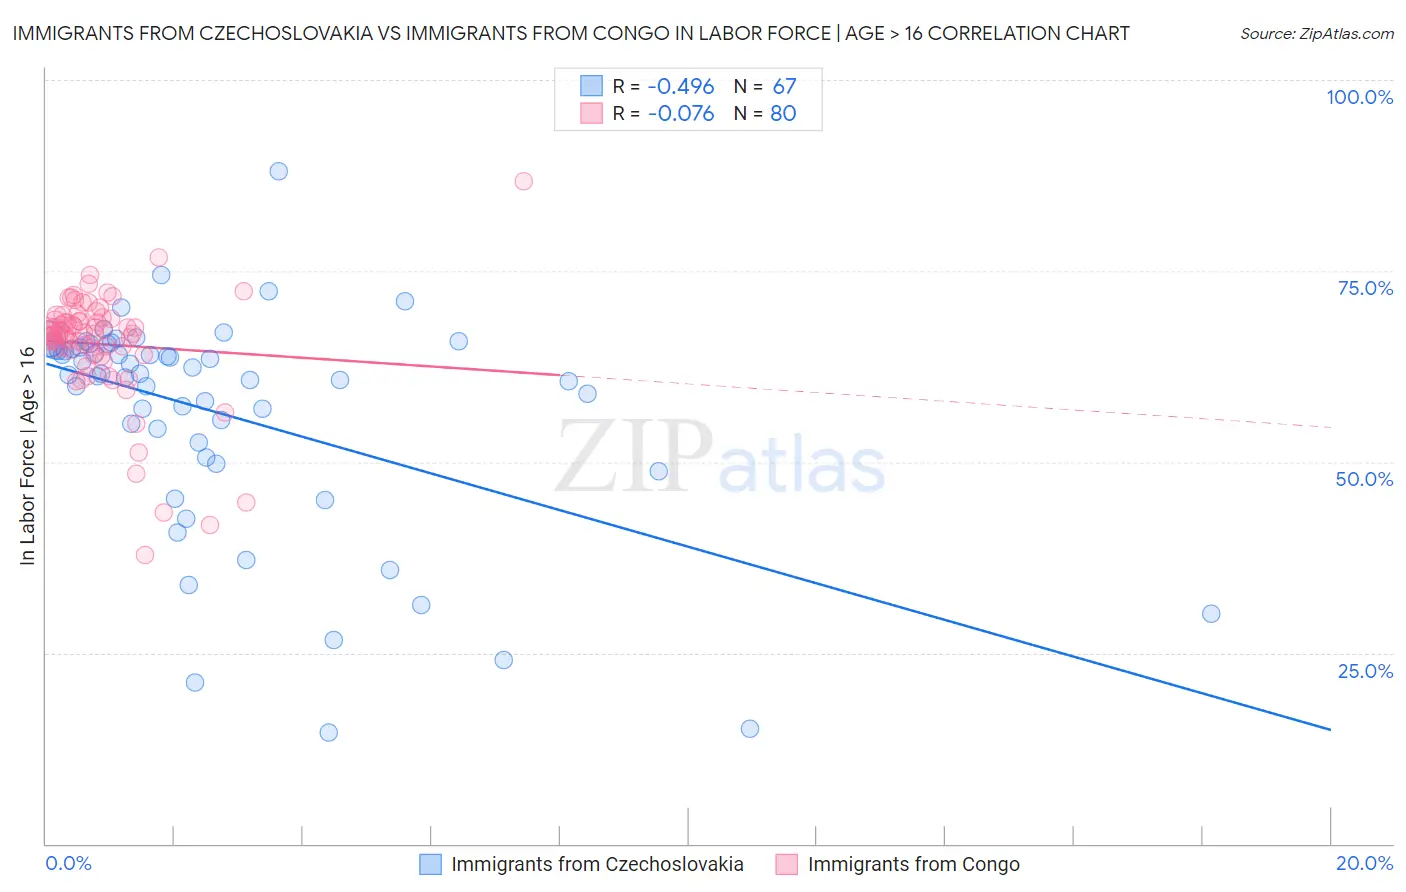
Immigrants from Czechoslovakia vs Immigrants from Congo In Labor Force | Age > 16 Correlation Chart
The statistical analysis conducted on geographies consisting of 195,457,762 people shows a moderate negative correlation between the proportion of Immigrants from Czechoslovakia and labor force participation rate among population ages 16 and over in the United States with a correlation coefficient (R) of -0.496 and weighted average of 64.8%. Similarly, the statistical analysis conducted on geographies consisting of 92,129,705 people shows a slight negative correlation between the proportion of Immigrants from Congo and labor force participation rate among population ages 16 and over in the United States with a correlation coefficient (R) of -0.076 and weighted average of 67.1%, a difference of 3.6%.
In Labor Force | Age > 16 Correlation Summary
| Measurement | Immigrants from Czechoslovakia | Immigrants from Congo |
| Minimum | 14.5% | 37.8% |
| Maximum | 88.1% | 86.8% |
| Range | 73.6% | 49.0% |
| Mean | 56.2% | 65.4% |
| Median | 61.4% | 66.8% |
| Interquartile 25% (IQ1) | 50.6% | 64.3% |
| Interquartile 75% (IQ3) | 64.9% | 68.6% |
| Interquartile Range (IQR) | 14.3% | 4.3% |
| Standard Deviation (Sample) | 14.7% | 7.5% |
| Standard Deviation (Population) | 14.6% | 7.4% |
Similar Demographics by In Labor Force | Age > 16
Demographics Similar to Immigrants from Czechoslovakia by In Labor Force | Age > 16
In terms of in labor force | age > 16, the demographic groups most similar to Immigrants from Czechoslovakia are Estonian (64.8%, a difference of 0.020%), Belgian (64.7%, a difference of 0.020%), U.S. Virgin Islander (64.7%, a difference of 0.030%), Alaskan Athabascan (64.8%, a difference of 0.040%), and Maltese (64.8%, a difference of 0.040%).
| Demographics | Rating | Rank | In Labor Force | Age > 16 |
| Belizeans | 16.2 /100 | #208 | Poor 64.8% |
| Immigrants | Trinidad and Tobago | 15.6 /100 | #209 | Poor 64.8% |
| Immigrants | Denmark | 14.7 /100 | #210 | Poor 64.8% |
| Fijians | 14.1 /100 | #211 | Poor 64.8% |
| Alaskan Athabascans | 13.9 /100 | #212 | Poor 64.8% |
| Maltese | 13.8 /100 | #213 | Poor 64.8% |
| Estonians | 13.1 /100 | #214 | Poor 64.8% |
| Immigrants | Czechoslovakia | 12.3 /100 | #215 | Poor 64.8% |
| Belgians | 11.4 /100 | #216 | Poor 64.7% |
| U.S. Virgin Islanders | 11.3 /100 | #217 | Poor 64.7% |
| Alsatians | 10.7 /100 | #218 | Poor 64.7% |
| Immigrants | Central America | 10.5 /100 | #219 | Poor 64.7% |
| Alaska Natives | 9.9 /100 | #220 | Tragic 64.7% |
| Immigrants | Micronesia | 9.6 /100 | #221 | Tragic 64.7% |
| Hawaiians | 9.3 /100 | #222 | Tragic 64.7% |
Demographics Similar to Immigrants from Congo by In Labor Force | Age > 16
In terms of in labor force | age > 16, the demographic groups most similar to Immigrants from Congo are Afghan (67.1%, a difference of 0.0%), Immigrants from Ghana (67.1%, a difference of 0.020%), Ghanaian (67.1%, a difference of 0.060%), Immigrants from South Central Asia (67.1%, a difference of 0.070%), and Immigrants from Western Africa (67.1%, a difference of 0.070%).
| Demographics | Rating | Rank | In Labor Force | Age > 16 |
| Immigrants | Africa | 100.0 /100 | #25 | Exceptional 67.4% |
| Immigrants | Cabo Verde | 100.0 /100 | #26 | Exceptional 67.3% |
| Zimbabweans | 100.0 /100 | #27 | Exceptional 67.3% |
| Immigrants | Morocco | 100.0 /100 | #28 | Exceptional 67.2% |
| Thais | 100.0 /100 | #29 | Exceptional 67.2% |
| Immigrants | Zaire | 100.0 /100 | #30 | Exceptional 67.2% |
| Ghanaians | 100.0 /100 | #31 | Exceptional 67.1% |
| Immigrants | Congo | 100.0 /100 | #32 | Exceptional 67.1% |
| Afghans | 100.0 /100 | #33 | Exceptional 67.1% |
| Immigrants | Ghana | 100.0 /100 | #34 | Exceptional 67.1% |
| Immigrants | South Central Asia | 100.0 /100 | #35 | Exceptional 67.1% |
| Immigrants | Western Africa | 100.0 /100 | #36 | Exceptional 67.1% |
| Immigrants | Afghanistan | 100.0 /100 | #37 | Exceptional 67.0% |
| Immigrants | Nigeria | 100.0 /100 | #38 | Exceptional 66.9% |
| Salvadorans | 100.0 /100 | #39 | Exceptional 66.8% |