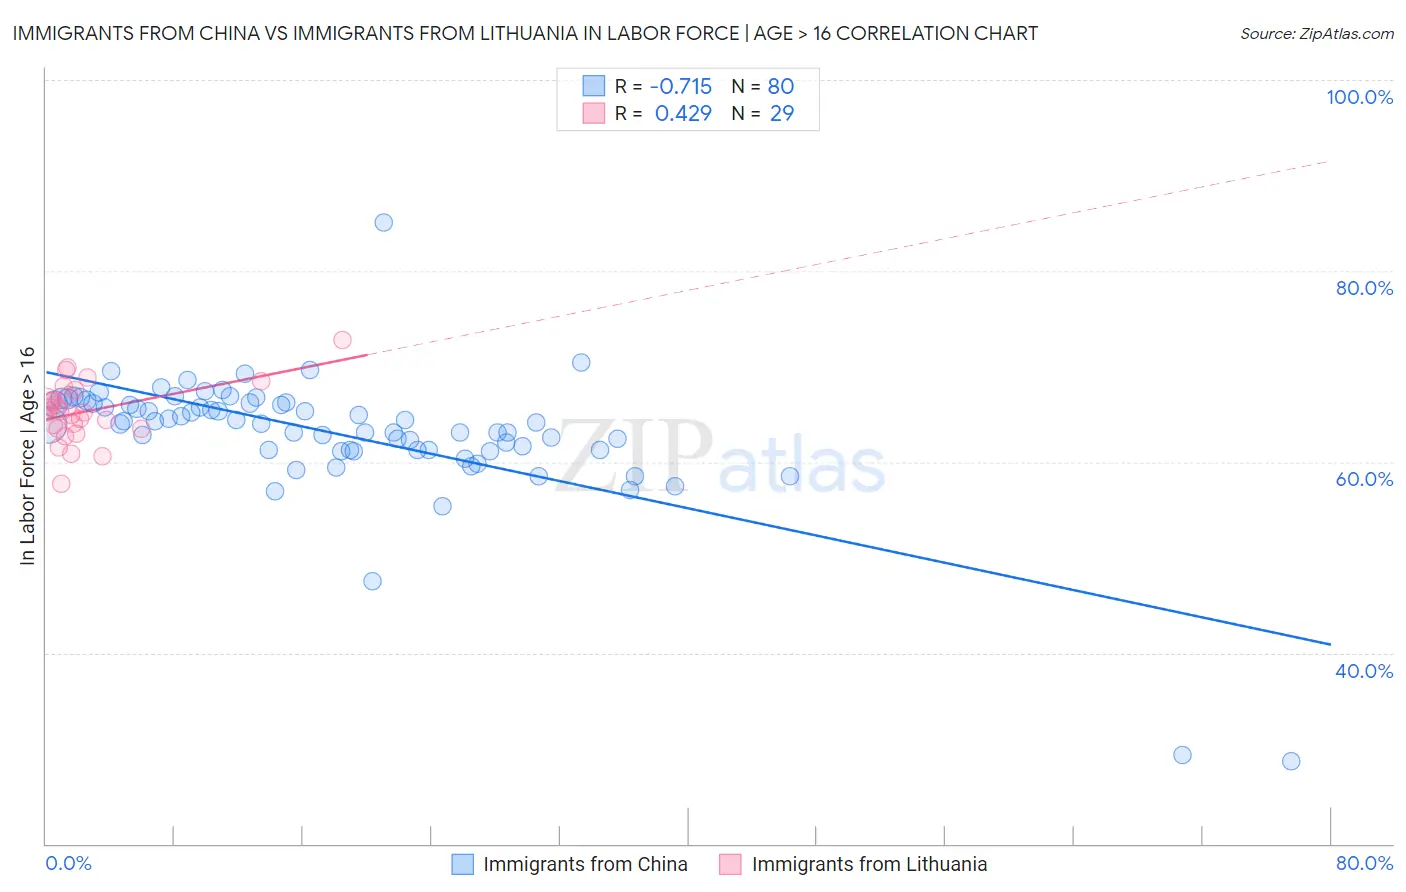
Immigrants from China vs Immigrants from Lithuania In Labor Force | Age > 16
COMPARE
Immigrants from China
Immigrants from Lithuania
In Labor Force | Age > 16
In Labor Force | Age > 16 Comparison
Immigrants from China
Immigrants from Lithuania
65.4%
IN LABOR FORCE | AGE > 16
80.5/ 100
METRIC RATING
153rd/ 347
METRIC RANK
65.6%
IN LABOR FORCE | AGE > 16
93.5/ 100
METRIC RATING
133rd/ 347
METRIC RANK
Immigrants from China vs Immigrants from Lithuania In Labor Force | Age > 16 Correlation Chart
The statistical analysis conducted on geographies consisting of 457,121,912 people shows a strong negative correlation between the proportion of Immigrants from China and labor force participation rate among population ages 16 and over in the United States with a correlation coefficient (R) of -0.715 and weighted average of 65.4%. Similarly, the statistical analysis conducted on geographies consisting of 117,714,489 people shows a moderate positive correlation between the proportion of Immigrants from Lithuania and labor force participation rate among population ages 16 and over in the United States with a correlation coefficient (R) of 0.429 and weighted average of 65.6%, a difference of 0.35%.
In Labor Force | Age > 16 Correlation Summary
| Measurement | Immigrants from China | Immigrants from Lithuania |
| Minimum | 28.6% | 57.7% |
| Maximum | 85.0% | 72.8% |
| Range | 56.4% | 15.1% |
| Mean | 63.0% | 65.3% |
| Median | 64.1% | 65.2% |
| Interquartile 25% (IQ1) | 61.2% | 63.5% |
| Interquartile 75% (IQ3) | 66.1% | 67.3% |
| Interquartile Range (IQR) | 4.9% | 3.8% |
| Standard Deviation (Sample) | 7.0% | 3.1% |
| Standard Deviation (Population) | 7.0% | 3.1% |
Demographics Similar to Immigrants from China and Immigrants from Lithuania by In Labor Force | Age > 16
In terms of in labor force | age > 16, the demographic groups most similar to Immigrants from China are Yugoslavian (65.4%, a difference of 0.010%), Immigrants (65.4%, a difference of 0.020%), Czech (65.4%, a difference of 0.020%), Immigrants from Albania (65.4%, a difference of 0.10%), and Bhutanese (65.5%, a difference of 0.12%). Similarly, the demographic groups most similar to Immigrants from Lithuania are Costa Rican (65.6%, a difference of 0.010%), Guatemalan (65.6%, a difference of 0.040%), Immigrants from Argentina (65.6%, a difference of 0.040%), Guamanian/Chamorro (65.6%, a difference of 0.050%), and Immigrants from West Indies (65.6%, a difference of 0.060%).
| Demographics | Rating | Rank | In Labor Force | Age > 16 |
| Immigrants | Lithuania | 93.5 /100 | #133 | Exceptional 65.6% |
| Costa Ricans | 93.2 /100 | #134 | Exceptional 65.6% |
| Guatemalans | 92.5 /100 | #135 | Exceptional 65.6% |
| Immigrants | Argentina | 92.4 /100 | #136 | Exceptional 65.6% |
| Guamanians/Chamorros | 92.4 /100 | #137 | Exceptional 65.6% |
| Immigrants | West Indies | 92.0 /100 | #138 | Exceptional 65.6% |
| Immigrants | Taiwan | 90.8 /100 | #139 | Exceptional 65.5% |
| Immigrants | Costa Rica | 90.8 /100 | #140 | Exceptional 65.5% |
| Samoans | 90.5 /100 | #141 | Exceptional 65.5% |
| Indians (Asian) | 89.5 /100 | #142 | Excellent 65.5% |
| Latvians | 89.4 /100 | #143 | Excellent 65.5% |
| Immigrants | Romania | 88.6 /100 | #144 | Excellent 65.5% |
| Tlingit-Haida | 88.3 /100 | #145 | Excellent 65.5% |
| Cypriots | 88.2 /100 | #146 | Excellent 65.5% |
| Immigrants | Oceania | 87.5 /100 | #147 | Excellent 65.5% |
| Bhutanese | 86.3 /100 | #148 | Excellent 65.5% |
| Immigrants | Albania | 85.7 /100 | #149 | Excellent 65.4% |
| Immigrants | Immigrants | 81.9 /100 | #150 | Excellent 65.4% |
| Czechs | 81.5 /100 | #151 | Excellent 65.4% |
| Yugoslavians | 81.3 /100 | #152 | Excellent 65.4% |
| Immigrants | China | 80.5 /100 | #153 | Excellent 65.4% |