Immigrants from the Azores vs Chickasaw In Labor Force | Age 20-64
COMPARE
Immigrants from the Azores
Chickasaw
In Labor Force | Age 20-64
In Labor Force | Age 20-64 Comparison
Immigrants from the Azores
Chickasaw
77.8%
IN LABOR FORCE | AGE 20-64
0.0/ 100
METRIC RATING
292nd/ 347
METRIC RANK
76.2%
IN LABOR FORCE | AGE 20-64
0.0/ 100
METRIC RATING
318th/ 347
METRIC RANK
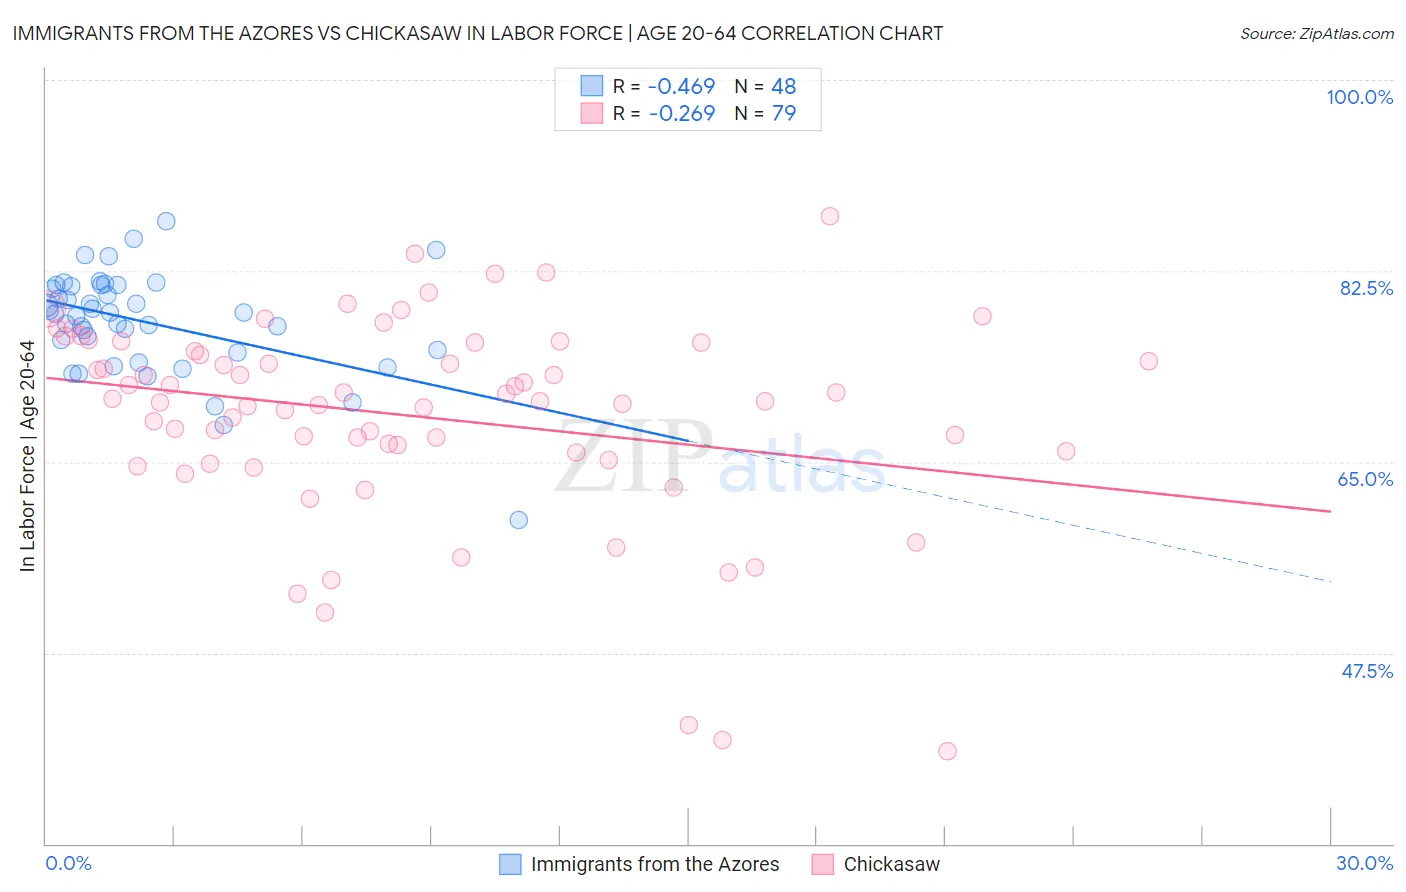
Immigrants from the Azores vs Chickasaw In Labor Force | Age 20-64 Correlation Chart
The statistical analysis conducted on geographies consisting of 46,256,974 people shows a moderate negative correlation between the proportion of Immigrants from the Azores and labor force participation rate among population between the ages 20 and 64 in the United States with a correlation coefficient (R) of -0.469 and weighted average of 77.8%. Similarly, the statistical analysis conducted on geographies consisting of 147,722,293 people shows a weak negative correlation between the proportion of Chickasaw and labor force participation rate among population between the ages 20 and 64 in the United States with a correlation coefficient (R) of -0.269 and weighted average of 76.2%, a difference of 2.1%.
In Labor Force | Age 20-64 Correlation Summary
| Measurement | Immigrants from the Azores | Chickasaw |
| Minimum | 59.7% | 38.5% |
| Maximum | 87.0% | 87.5% |
| Range | 27.3% | 49.0% |
| Mean | 77.8% | 69.2% |
| Median | 78.6% | 70.5% |
| Interquartile 25% (IQ1) | 75.1% | 65.8% |
| Interquartile 75% (IQ3) | 81.1% | 75.9% |
| Interquartile Range (IQR) | 6.0% | 10.1% |
| Standard Deviation (Sample) | 4.8% | 9.4% |
| Standard Deviation (Population) | 4.8% | 9.4% |
Similar Demographics by In Labor Force | Age 20-64
Demographics Similar to Immigrants from the Azores by In Labor Force | Age 20-64
In terms of in labor force | age 20-64, the demographic groups most similar to Immigrants from the Azores are Delaware (77.8%, a difference of 0.040%), Spanish American (77.8%, a difference of 0.050%), Immigrants from Bangladesh (77.9%, a difference of 0.10%), African (77.9%, a difference of 0.12%), and Immigrants from Central America (77.7%, a difference of 0.12%).
| Demographics | Rating | Rank | In Labor Force | Age 20-64 |
| Osage | 0.0 /100 | #285 | Tragic 78.0% |
| Immigrants | Belize | 0.0 /100 | #286 | Tragic 78.0% |
| Vietnamese | 0.0 /100 | #287 | Tragic 78.0% |
| Hmong | 0.0 /100 | #288 | Tragic 77.9% |
| Africans | 0.0 /100 | #289 | Tragic 77.9% |
| Immigrants | Bangladesh | 0.0 /100 | #290 | Tragic 77.9% |
| Spanish Americans | 0.0 /100 | #291 | Tragic 77.8% |
| Immigrants | Azores | 0.0 /100 | #292 | Tragic 77.8% |
| Delaware | 0.0 /100 | #293 | Tragic 77.8% |
| Immigrants | Central America | 0.0 /100 | #294 | Tragic 77.7% |
| Immigrants | Grenada | 0.0 /100 | #295 | Tragic 77.7% |
| Immigrants | Dominican Republic | 0.0 /100 | #296 | Tragic 77.7% |
| Dominicans | 0.0 /100 | #297 | Tragic 77.7% |
| Cree | 0.0 /100 | #298 | Tragic 77.7% |
| Hispanics or Latinos | 0.0 /100 | #299 | Tragic 77.6% |
Demographics Similar to Chickasaw by In Labor Force | Age 20-64
In terms of in labor force | age 20-64, the demographic groups most similar to Chickasaw are Cherokee (76.2%, a difference of 0.040%), Inupiat (76.1%, a difference of 0.16%), Yaqui (76.5%, a difference of 0.44%), Yakama (75.8%, a difference of 0.55%), and Ottawa (76.7%, a difference of 0.63%).
| Demographics | Rating | Rank | In Labor Force | Age 20-64 |
| Blackfeet | 0.0 /100 | #311 | Tragic 77.0% |
| Alaskan Athabascans | 0.0 /100 | #312 | Tragic 76.9% |
| Shoshone | 0.0 /100 | #313 | Tragic 76.8% |
| Blacks/African Americans | 0.0 /100 | #314 | Tragic 76.8% |
| Ottawa | 0.0 /100 | #315 | Tragic 76.7% |
| Yaqui | 0.0 /100 | #316 | Tragic 76.5% |
| Cherokee | 0.0 /100 | #317 | Tragic 76.2% |
| Chickasaw | 0.0 /100 | #318 | Tragic 76.2% |
| Inupiat | 0.0 /100 | #319 | Tragic 76.1% |
| Yakama | 0.0 /100 | #320 | Tragic 75.8% |
| Seminole | 0.0 /100 | #321 | Tragic 75.5% |
| Dutch West Indians | 0.0 /100 | #322 | Tragic 75.5% |
| Cajuns | 0.0 /100 | #323 | Tragic 75.5% |
| Choctaw | 0.0 /100 | #324 | Tragic 75.4% |
| Menominee | 0.0 /100 | #325 | Tragic 75.3% |