Creek vs Chickasaw In Labor Force | Age 20-64
COMPARE
Creek
Chickasaw
In Labor Force | Age 20-64
In Labor Force | Age 20-64 Comparison
Creek
Chickasaw
75.1%
IN LABOR FORCE | AGE 20-64
0.0/ 100
METRIC RATING
326th/ 347
METRIC RANK
76.2%
IN LABOR FORCE | AGE 20-64
0.0/ 100
METRIC RATING
318th/ 347
METRIC RANK
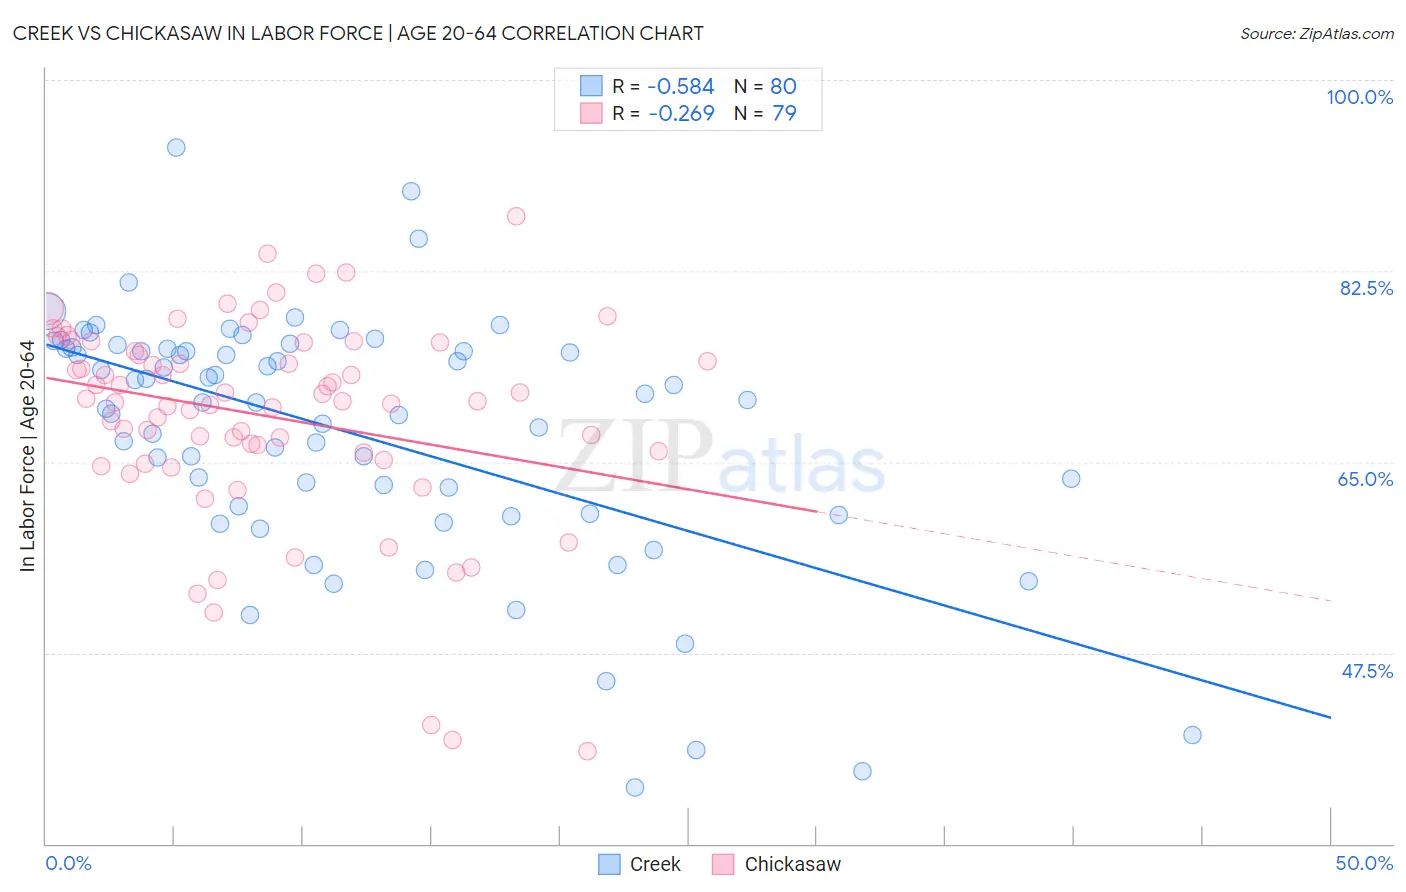
Creek vs Chickasaw In Labor Force | Age 20-64 Correlation Chart
The statistical analysis conducted on geographies consisting of 178,467,518 people shows a substantial negative correlation between the proportion of Creek and labor force participation rate among population between the ages 20 and 64 in the United States with a correlation coefficient (R) of -0.584 and weighted average of 75.1%. Similarly, the statistical analysis conducted on geographies consisting of 147,722,293 people shows a weak negative correlation between the proportion of Chickasaw and labor force participation rate among population between the ages 20 and 64 in the United States with a correlation coefficient (R) of -0.269 and weighted average of 76.2%, a difference of 1.4%.
In Labor Force | Age 20-64 Correlation Summary
| Measurement | Creek | Chickasaw |
| Minimum | 35.2% | 38.5% |
| Maximum | 93.8% | 87.5% |
| Range | 58.6% | 49.0% |
| Mean | 67.7% | 69.2% |
| Median | 70.6% | 70.5% |
| Interquartile 25% (IQ1) | 60.6% | 65.8% |
| Interquartile 75% (IQ3) | 75.4% | 75.9% |
| Interquartile Range (IQR) | 14.8% | 10.1% |
| Standard Deviation (Sample) | 11.5% | 9.4% |
| Standard Deviation (Population) | 11.4% | 9.4% |
Demographics Similar to Creek and Chickasaw by In Labor Force | Age 20-64
In terms of in labor force | age 20-64, the demographic groups most similar to Creek are Sioux (75.0%, a difference of 0.18%), Kiowa (75.0%, a difference of 0.20%), Menominee (75.3%, a difference of 0.22%), Choctaw (75.4%, a difference of 0.36%), and Cheyenne (74.8%, a difference of 0.40%). Similarly, the demographic groups most similar to Chickasaw are Cherokee (76.2%, a difference of 0.040%), Inupiat (76.1%, a difference of 0.16%), Yaqui (76.5%, a difference of 0.44%), Yakama (75.8%, a difference of 0.55%), and Ottawa (76.7%, a difference of 0.63%).
| Demographics | Rating | Rank | In Labor Force | Age 20-64 |
| Alaskan Athabascans | 0.0 /100 | #312 | Tragic 76.9% |
| Shoshone | 0.0 /100 | #313 | Tragic 76.8% |
| Blacks/African Americans | 0.0 /100 | #314 | Tragic 76.8% |
| Ottawa | 0.0 /100 | #315 | Tragic 76.7% |
| Yaqui | 0.0 /100 | #316 | Tragic 76.5% |
| Cherokee | 0.0 /100 | #317 | Tragic 76.2% |
| Chickasaw | 0.0 /100 | #318 | Tragic 76.2% |
| Inupiat | 0.0 /100 | #319 | Tragic 76.1% |
| Yakama | 0.0 /100 | #320 | Tragic 75.8% |
| Seminole | 0.0 /100 | #321 | Tragic 75.5% |
| Dutch West Indians | 0.0 /100 | #322 | Tragic 75.5% |
| Cajuns | 0.0 /100 | #323 | Tragic 75.5% |
| Choctaw | 0.0 /100 | #324 | Tragic 75.4% |
| Menominee | 0.0 /100 | #325 | Tragic 75.3% |
| Creek | 0.0 /100 | #326 | Tragic 75.1% |
| Sioux | 0.0 /100 | #327 | Tragic 75.0% |
| Kiowa | 0.0 /100 | #328 | Tragic 75.0% |
| Cheyenne | 0.0 /100 | #329 | Tragic 74.8% |
| Colville | 0.0 /100 | #330 | Tragic 74.8% |
| Paiute | 0.0 /100 | #331 | Tragic 74.7% |
| Arapaho | 0.0 /100 | #332 | Tragic 74.4% |