Immigrants from the Azores vs Afghan In Labor Force | Age 20-64
COMPARE
Immigrants from the Azores
Afghan
In Labor Force | Age 20-64
In Labor Force | Age 20-64 Comparison
Immigrants from the Azores
Afghans
77.8%
IN LABOR FORCE | AGE 20-64
0.0/ 100
METRIC RATING
292nd/ 347
METRIC RANK
80.3%
IN LABOR FORCE | AGE 20-64
98.9/ 100
METRIC RATING
57th/ 347
METRIC RANK
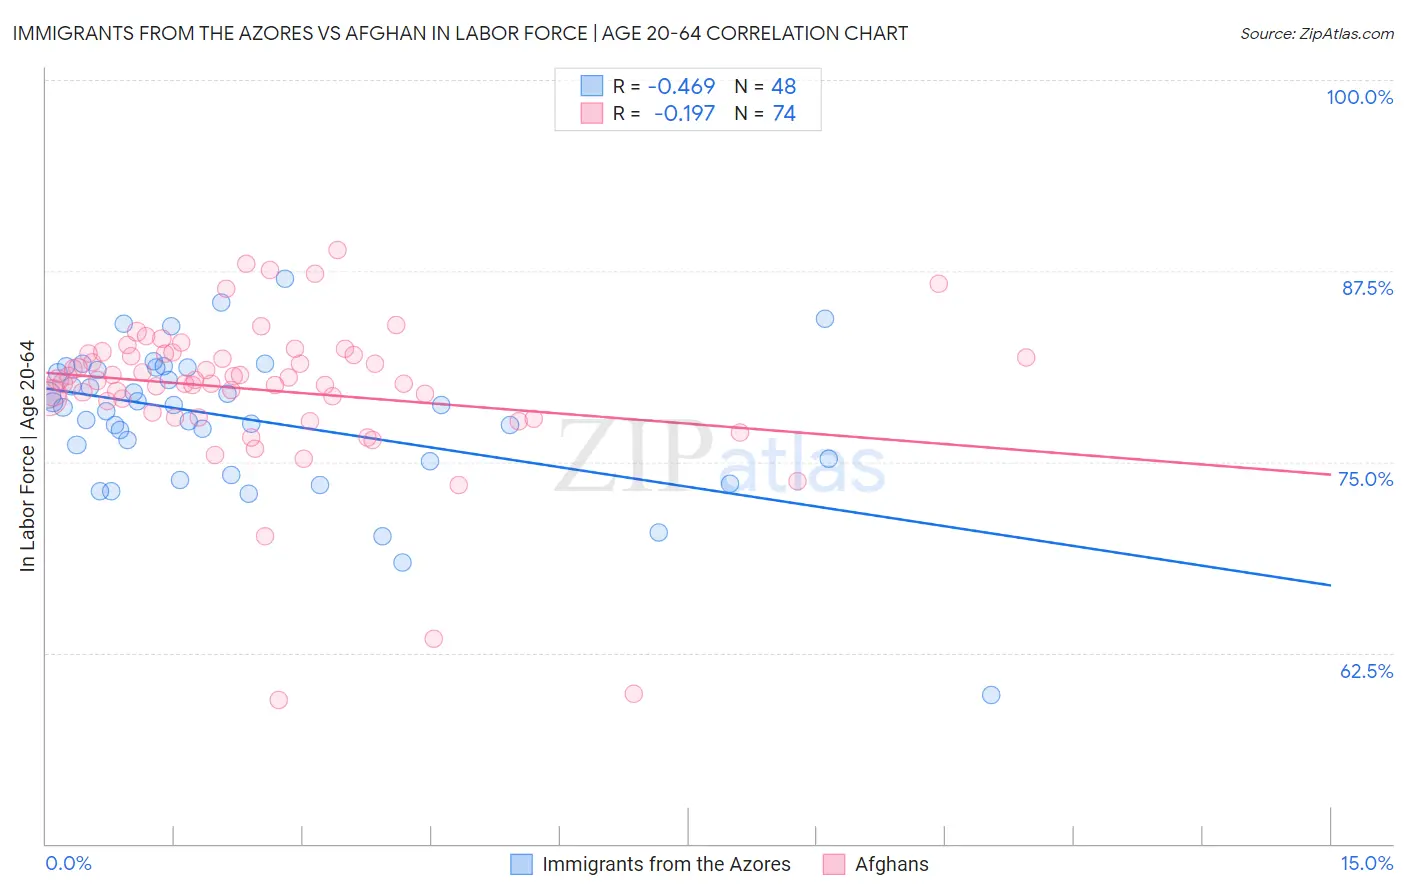
Immigrants from the Azores vs Afghan In Labor Force | Age 20-64 Correlation Chart
The statistical analysis conducted on geographies consisting of 46,256,974 people shows a moderate negative correlation between the proportion of Immigrants from the Azores and labor force participation rate among population between the ages 20 and 64 in the United States with a correlation coefficient (R) of -0.469 and weighted average of 77.8%. Similarly, the statistical analysis conducted on geographies consisting of 148,874,971 people shows a poor negative correlation between the proportion of Afghans and labor force participation rate among population between the ages 20 and 64 in the United States with a correlation coefficient (R) of -0.197 and weighted average of 80.3%, a difference of 3.2%.
In Labor Force | Age 20-64 Correlation Summary
| Measurement | Immigrants from the Azores | Afghan |
| Minimum | 59.7% | 59.4% |
| Maximum | 87.0% | 88.9% |
| Range | 27.3% | 29.5% |
| Mean | 77.8% | 79.7% |
| Median | 78.6% | 80.3% |
| Interquartile 25% (IQ1) | 75.1% | 78.3% |
| Interquartile 75% (IQ3) | 81.1% | 82.1% |
| Interquartile Range (IQR) | 6.0% | 3.8% |
| Standard Deviation (Sample) | 4.8% | 5.1% |
| Standard Deviation (Population) | 4.8% | 5.1% |
Similar Demographics by In Labor Force | Age 20-64
Demographics Similar to Immigrants from the Azores by In Labor Force | Age 20-64
In terms of in labor force | age 20-64, the demographic groups most similar to Immigrants from the Azores are Delaware (77.8%, a difference of 0.040%), Spanish American (77.8%, a difference of 0.050%), Immigrants from Bangladesh (77.9%, a difference of 0.10%), African (77.9%, a difference of 0.12%), and Immigrants from Central America (77.7%, a difference of 0.12%).
| Demographics | Rating | Rank | In Labor Force | Age 20-64 |
| Osage | 0.0 /100 | #285 | Tragic 78.0% |
| Immigrants | Belize | 0.0 /100 | #286 | Tragic 78.0% |
| Vietnamese | 0.0 /100 | #287 | Tragic 78.0% |
| Hmong | 0.0 /100 | #288 | Tragic 77.9% |
| Africans | 0.0 /100 | #289 | Tragic 77.9% |
| Immigrants | Bangladesh | 0.0 /100 | #290 | Tragic 77.9% |
| Spanish Americans | 0.0 /100 | #291 | Tragic 77.8% |
| Immigrants | Azores | 0.0 /100 | #292 | Tragic 77.8% |
| Delaware | 0.0 /100 | #293 | Tragic 77.8% |
| Immigrants | Central America | 0.0 /100 | #294 | Tragic 77.7% |
| Immigrants | Grenada | 0.0 /100 | #295 | Tragic 77.7% |
| Immigrants | Dominican Republic | 0.0 /100 | #296 | Tragic 77.7% |
| Dominicans | 0.0 /100 | #297 | Tragic 77.7% |
| Cree | 0.0 /100 | #298 | Tragic 77.7% |
| Hispanics or Latinos | 0.0 /100 | #299 | Tragic 77.6% |
Demographics Similar to Afghans by In Labor Force | Age 20-64
In terms of in labor force | age 20-64, the demographic groups most similar to Afghans are Immigrants from Northern Africa (80.3%, a difference of 0.0%), Immigrants from Cabo Verde (80.3%, a difference of 0.010%), Serbian (80.3%, a difference of 0.010%), Swedish (80.3%, a difference of 0.010%), and Tongan (80.3%, a difference of 0.020%).
| Demographics | Rating | Rank | In Labor Force | Age 20-64 |
| Immigrants | Sudan | 99.4 /100 | #50 | Exceptional 80.4% |
| Immigrants | Sri Lanka | 99.3 /100 | #51 | Exceptional 80.4% |
| Turks | 99.2 /100 | #52 | Exceptional 80.3% |
| Immigrants | Peru | 99.2 /100 | #53 | Exceptional 80.3% |
| Peruvians | 99.1 /100 | #54 | Exceptional 80.3% |
| Immigrants | Cabo Verde | 99.0 /100 | #55 | Exceptional 80.3% |
| Immigrants | Northern Africa | 99.0 /100 | #56 | Exceptional 80.3% |
| Afghans | 98.9 /100 | #57 | Exceptional 80.3% |
| Serbians | 98.9 /100 | #58 | Exceptional 80.3% |
| Swedes | 98.9 /100 | #59 | Exceptional 80.3% |
| Tongans | 98.8 /100 | #60 | Exceptional 80.3% |
| Burmese | 98.8 /100 | #61 | Exceptional 80.3% |
| Carpatho Rusyns | 98.8 /100 | #62 | Exceptional 80.3% |
| Immigrants | Korea | 98.8 /100 | #63 | Exceptional 80.3% |
| Immigrants | Albania | 98.7 /100 | #64 | Exceptional 80.3% |