Immigrants from the Azores vs Immigrants from Guatemala In Labor Force | Age 20-64
COMPARE
Immigrants from the Azores
Immigrants from Guatemala
In Labor Force | Age 20-64
In Labor Force | Age 20-64 Comparison
Immigrants from the Azores
Immigrants from Guatemala
77.8%
IN LABOR FORCE | AGE 20-64
0.0/ 100
METRIC RATING
292nd/ 347
METRIC RANK
78.7%
IN LABOR FORCE | AGE 20-64
0.4/ 100
METRIC RATING
258th/ 347
METRIC RANK
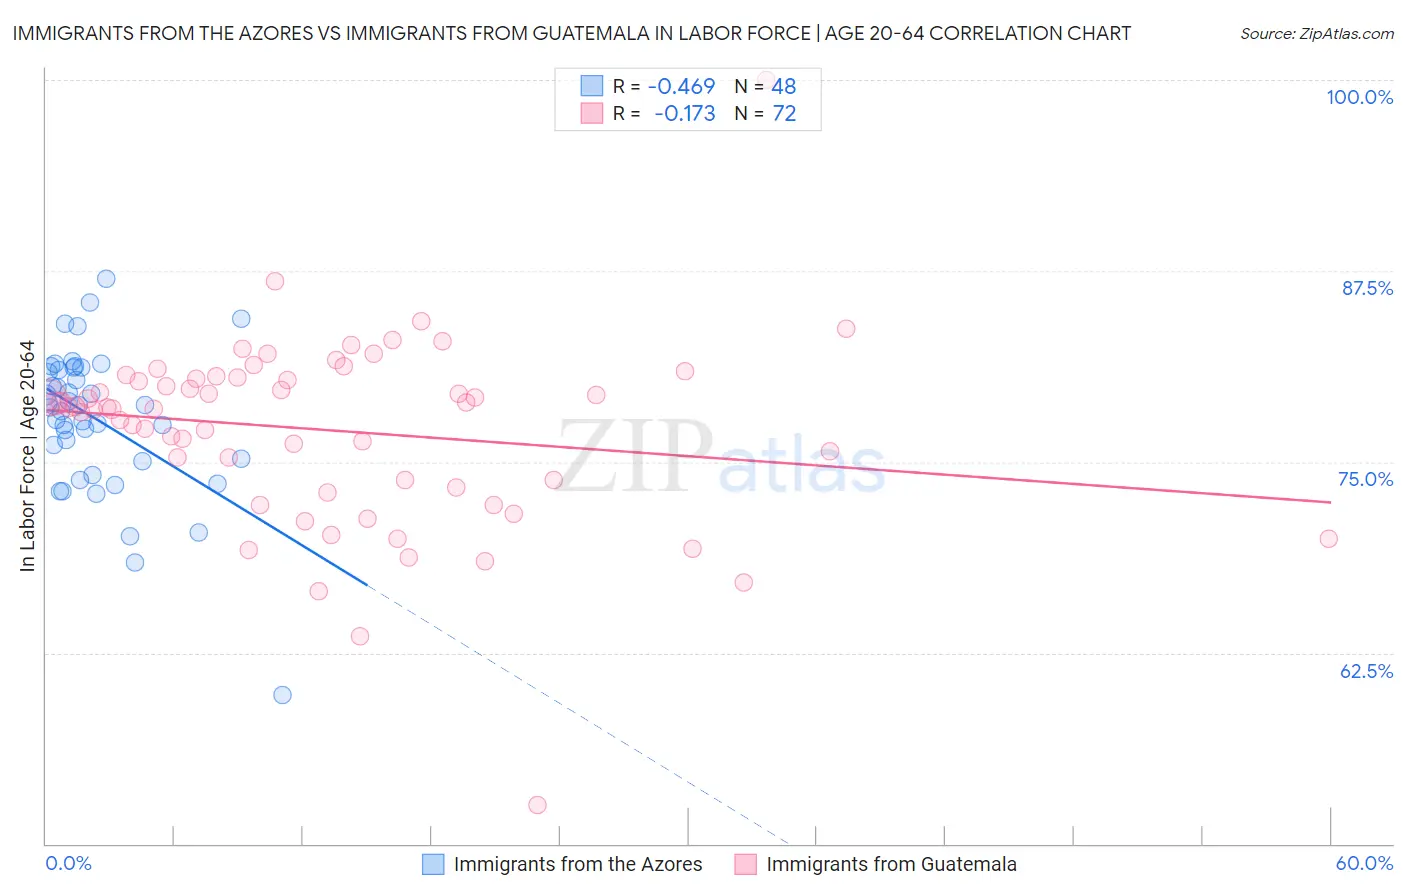
Immigrants from the Azores vs Immigrants from Guatemala In Labor Force | Age 20-64 Correlation Chart
The statistical analysis conducted on geographies consisting of 46,256,974 people shows a moderate negative correlation between the proportion of Immigrants from the Azores and labor force participation rate among population between the ages 20 and 64 in the United States with a correlation coefficient (R) of -0.469 and weighted average of 77.8%. Similarly, the statistical analysis conducted on geographies consisting of 377,275,045 people shows a poor negative correlation between the proportion of Immigrants from Guatemala and labor force participation rate among population between the ages 20 and 64 in the United States with a correlation coefficient (R) of -0.173 and weighted average of 78.7%, a difference of 1.1%.
In Labor Force | Age 20-64 Correlation Summary
| Measurement | Immigrants from the Azores | Immigrants from Guatemala |
| Minimum | 59.7% | 52.5% |
| Maximum | 87.0% | 100.0% |
| Range | 27.3% | 47.5% |
| Mean | 77.8% | 77.1% |
| Median | 78.6% | 78.6% |
| Interquartile 25% (IQ1) | 75.1% | 73.6% |
| Interquartile 75% (IQ3) | 81.1% | 80.5% |
| Interquartile Range (IQR) | 6.0% | 6.9% |
| Standard Deviation (Sample) | 4.8% | 6.2% |
| Standard Deviation (Population) | 4.8% | 6.2% |
Similar Demographics by In Labor Force | Age 20-64
Demographics Similar to Immigrants from the Azores by In Labor Force | Age 20-64
In terms of in labor force | age 20-64, the demographic groups most similar to Immigrants from the Azores are Delaware (77.8%, a difference of 0.040%), Spanish American (77.8%, a difference of 0.050%), Immigrants from Bangladesh (77.9%, a difference of 0.10%), African (77.9%, a difference of 0.12%), and Immigrants from Central America (77.7%, a difference of 0.12%).
| Demographics | Rating | Rank | In Labor Force | Age 20-64 |
| Osage | 0.0 /100 | #285 | Tragic 78.0% |
| Immigrants | Belize | 0.0 /100 | #286 | Tragic 78.0% |
| Vietnamese | 0.0 /100 | #287 | Tragic 78.0% |
| Hmong | 0.0 /100 | #288 | Tragic 77.9% |
| Africans | 0.0 /100 | #289 | Tragic 77.9% |
| Immigrants | Bangladesh | 0.0 /100 | #290 | Tragic 77.9% |
| Spanish Americans | 0.0 /100 | #291 | Tragic 77.8% |
| Immigrants | Azores | 0.0 /100 | #292 | Tragic 77.8% |
| Delaware | 0.0 /100 | #293 | Tragic 77.8% |
| Immigrants | Central America | 0.0 /100 | #294 | Tragic 77.7% |
| Immigrants | Grenada | 0.0 /100 | #295 | Tragic 77.7% |
| Immigrants | Dominican Republic | 0.0 /100 | #296 | Tragic 77.7% |
| Dominicans | 0.0 /100 | #297 | Tragic 77.7% |
| Cree | 0.0 /100 | #298 | Tragic 77.7% |
| Hispanics or Latinos | 0.0 /100 | #299 | Tragic 77.6% |
Demographics Similar to Immigrants from Guatemala by In Labor Force | Age 20-64
In terms of in labor force | age 20-64, the demographic groups most similar to Immigrants from Guatemala are Guatemalan (78.7%, a difference of 0.0%), Hawaiian (78.7%, a difference of 0.020%), Celtic (78.7%, a difference of 0.020%), Tsimshian (78.7%, a difference of 0.030%), and Basque (78.7%, a difference of 0.040%).
| Demographics | Rating | Rank | In Labor Force | Age 20-64 |
| Barbadians | 0.7 /100 | #251 | Tragic 78.8% |
| Immigrants | Honduras | 0.6 /100 | #252 | Tragic 78.7% |
| Basques | 0.5 /100 | #253 | Tragic 78.7% |
| Immigrants | Lebanon | 0.5 /100 | #254 | Tragic 78.7% |
| Hawaiians | 0.5 /100 | #255 | Tragic 78.7% |
| Celtics | 0.5 /100 | #256 | Tragic 78.7% |
| Guatemalans | 0.4 /100 | #257 | Tragic 78.7% |
| Immigrants | Guatemala | 0.4 /100 | #258 | Tragic 78.7% |
| Tsimshian | 0.4 /100 | #259 | Tragic 78.7% |
| Immigrants | Fiji | 0.3 /100 | #260 | Tragic 78.6% |
| Whites/Caucasians | 0.2 /100 | #261 | Tragic 78.5% |
| Fijians | 0.1 /100 | #262 | Tragic 78.4% |
| Pennsylvania Germans | 0.1 /100 | #263 | Tragic 78.4% |
| Spaniards | 0.1 /100 | #264 | Tragic 78.4% |
| British West Indians | 0.1 /100 | #265 | Tragic 78.4% |