Immigrants from the Azores vs Bolivian In Labor Force | Age 20-64
COMPARE
Immigrants from the Azores
Bolivian
In Labor Force | Age 20-64
In Labor Force | Age 20-64 Comparison
Immigrants from the Azores
Bolivians
77.8%
IN LABOR FORCE | AGE 20-64
0.0/ 100
METRIC RATING
292nd/ 347
METRIC RANK
81.7%
IN LABOR FORCE | AGE 20-64
100.0/ 100
METRIC RATING
5th/ 347
METRIC RANK
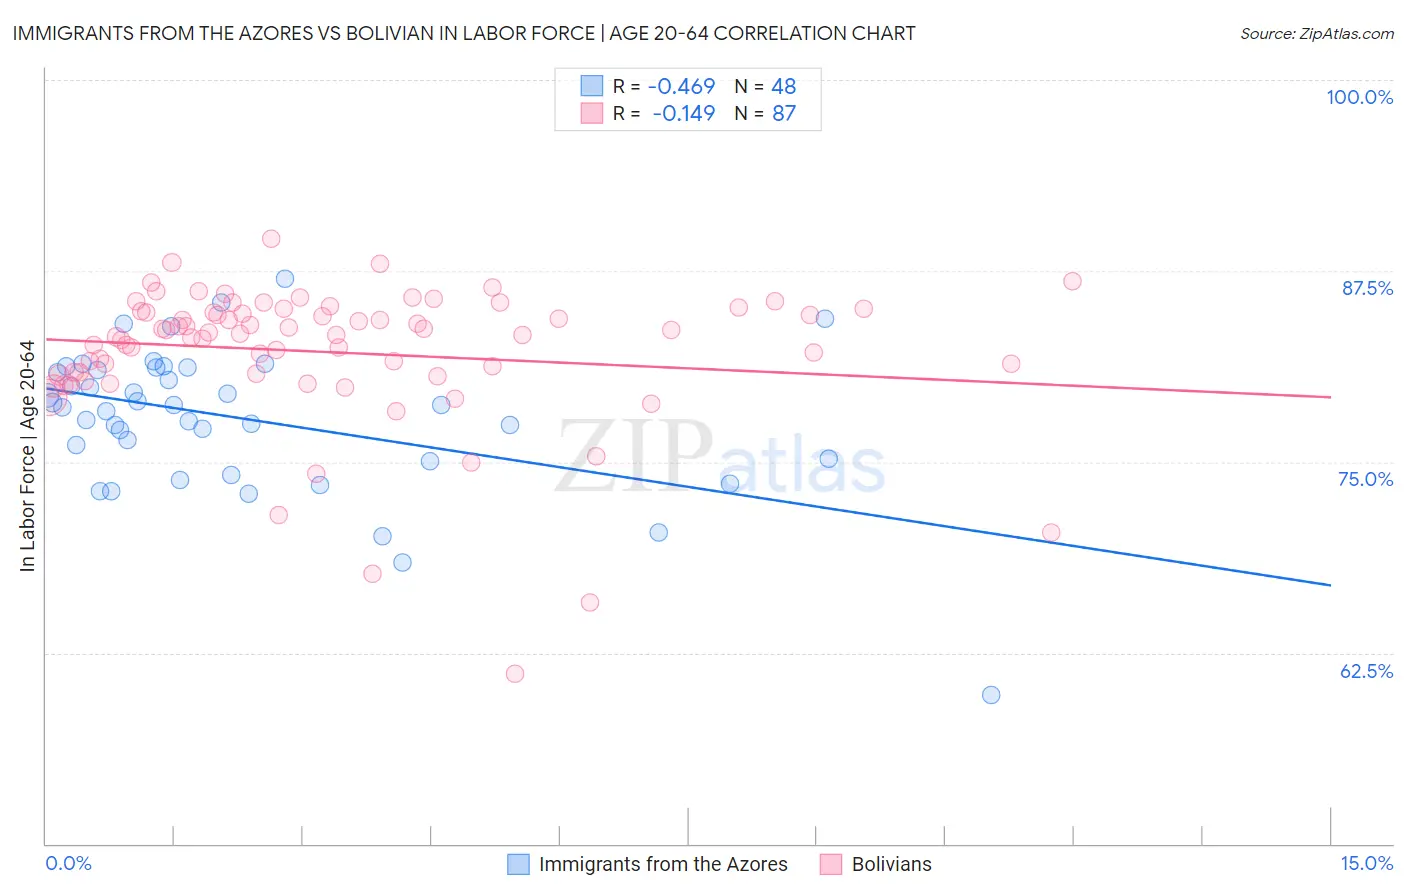
Immigrants from the Azores vs Bolivian In Labor Force | Age 20-64 Correlation Chart
The statistical analysis conducted on geographies consisting of 46,256,974 people shows a moderate negative correlation between the proportion of Immigrants from the Azores and labor force participation rate among population between the ages 20 and 64 in the United States with a correlation coefficient (R) of -0.469 and weighted average of 77.8%. Similarly, the statistical analysis conducted on geographies consisting of 184,684,128 people shows a poor negative correlation between the proportion of Bolivians and labor force participation rate among population between the ages 20 and 64 in the United States with a correlation coefficient (R) of -0.149 and weighted average of 81.7%, a difference of 5.0%.
In Labor Force | Age 20-64 Correlation Summary
| Measurement | Immigrants from the Azores | Bolivian |
| Minimum | 59.7% | 61.1% |
| Maximum | 87.0% | 89.6% |
| Range | 27.3% | 28.5% |
| Mean | 77.8% | 82.2% |
| Median | 78.6% | 83.4% |
| Interquartile 25% (IQ1) | 75.1% | 80.8% |
| Interquartile 75% (IQ3) | 81.1% | 84.9% |
| Interquartile Range (IQR) | 6.0% | 4.1% |
| Standard Deviation (Sample) | 4.8% | 4.7% |
| Standard Deviation (Population) | 4.8% | 4.7% |
Similar Demographics by In Labor Force | Age 20-64
Demographics Similar to Immigrants from the Azores by In Labor Force | Age 20-64
In terms of in labor force | age 20-64, the demographic groups most similar to Immigrants from the Azores are Delaware (77.8%, a difference of 0.040%), Spanish American (77.8%, a difference of 0.050%), Immigrants from Bangladesh (77.9%, a difference of 0.10%), African (77.9%, a difference of 0.12%), and Immigrants from Central America (77.7%, a difference of 0.12%).
| Demographics | Rating | Rank | In Labor Force | Age 20-64 |
| Osage | 0.0 /100 | #285 | Tragic 78.0% |
| Immigrants | Belize | 0.0 /100 | #286 | Tragic 78.0% |
| Vietnamese | 0.0 /100 | #287 | Tragic 78.0% |
| Hmong | 0.0 /100 | #288 | Tragic 77.9% |
| Africans | 0.0 /100 | #289 | Tragic 77.9% |
| Immigrants | Bangladesh | 0.0 /100 | #290 | Tragic 77.9% |
| Spanish Americans | 0.0 /100 | #291 | Tragic 77.8% |
| Immigrants | Azores | 0.0 /100 | #292 | Tragic 77.8% |
| Delaware | 0.0 /100 | #293 | Tragic 77.8% |
| Immigrants | Central America | 0.0 /100 | #294 | Tragic 77.7% |
| Immigrants | Grenada | 0.0 /100 | #295 | Tragic 77.7% |
| Immigrants | Dominican Republic | 0.0 /100 | #296 | Tragic 77.7% |
| Dominicans | 0.0 /100 | #297 | Tragic 77.7% |
| Cree | 0.0 /100 | #298 | Tragic 77.7% |
| Hispanics or Latinos | 0.0 /100 | #299 | Tragic 77.6% |
Demographics Similar to Bolivians by In Labor Force | Age 20-64
In terms of in labor force | age 20-64, the demographic groups most similar to Bolivians are Somali (81.6%, a difference of 0.11%), Immigrants from Cameroon (81.6%, a difference of 0.15%), Immigrants from Somalia (81.6%, a difference of 0.17%), Sierra Leonean (81.5%, a difference of 0.17%), and Luxembourger (81.9%, a difference of 0.20%).
| Demographics | Rating | Rank | In Labor Force | Age 20-64 |
| Immigrants | Ethiopia | 100.0 /100 | #1 | Exceptional 82.1% |
| Ethiopians | 100.0 /100 | #2 | Exceptional 82.0% |
| Immigrants | Bolivia | 100.0 /100 | #3 | Exceptional 81.9% |
| Luxembourgers | 100.0 /100 | #4 | Exceptional 81.9% |
| Bolivians | 100.0 /100 | #5 | Exceptional 81.7% |
| Somalis | 100.0 /100 | #6 | Exceptional 81.6% |
| Immigrants | Cameroon | 100.0 /100 | #7 | Exceptional 81.6% |
| Immigrants | Somalia | 100.0 /100 | #8 | Exceptional 81.6% |
| Sierra Leoneans | 100.0 /100 | #9 | Exceptional 81.5% |
| Immigrants | Sierra Leone | 100.0 /100 | #10 | Exceptional 81.5% |
| Immigrants | Eastern Africa | 100.0 /100 | #11 | Exceptional 81.3% |
| Immigrants | Eritrea | 100.0 /100 | #12 | Exceptional 81.3% |
| Immigrants | India | 100.0 /100 | #13 | Exceptional 81.3% |
| Cambodians | 100.0 /100 | #14 | Exceptional 81.1% |
| Bulgarians | 100.0 /100 | #15 | Exceptional 81.1% |