Immigrants from Netherlands vs Chickasaw In Labor Force | Age 20-64
COMPARE
Immigrants from Netherlands
Chickasaw
In Labor Force | Age 20-64
In Labor Force | Age 20-64 Comparison
Immigrants from Netherlands
Chickasaw
79.5%
IN LABOR FORCE | AGE 20-64
45.2/ 100
METRIC RATING
177th/ 347
METRIC RANK
76.2%
IN LABOR FORCE | AGE 20-64
0.0/ 100
METRIC RATING
318th/ 347
METRIC RANK
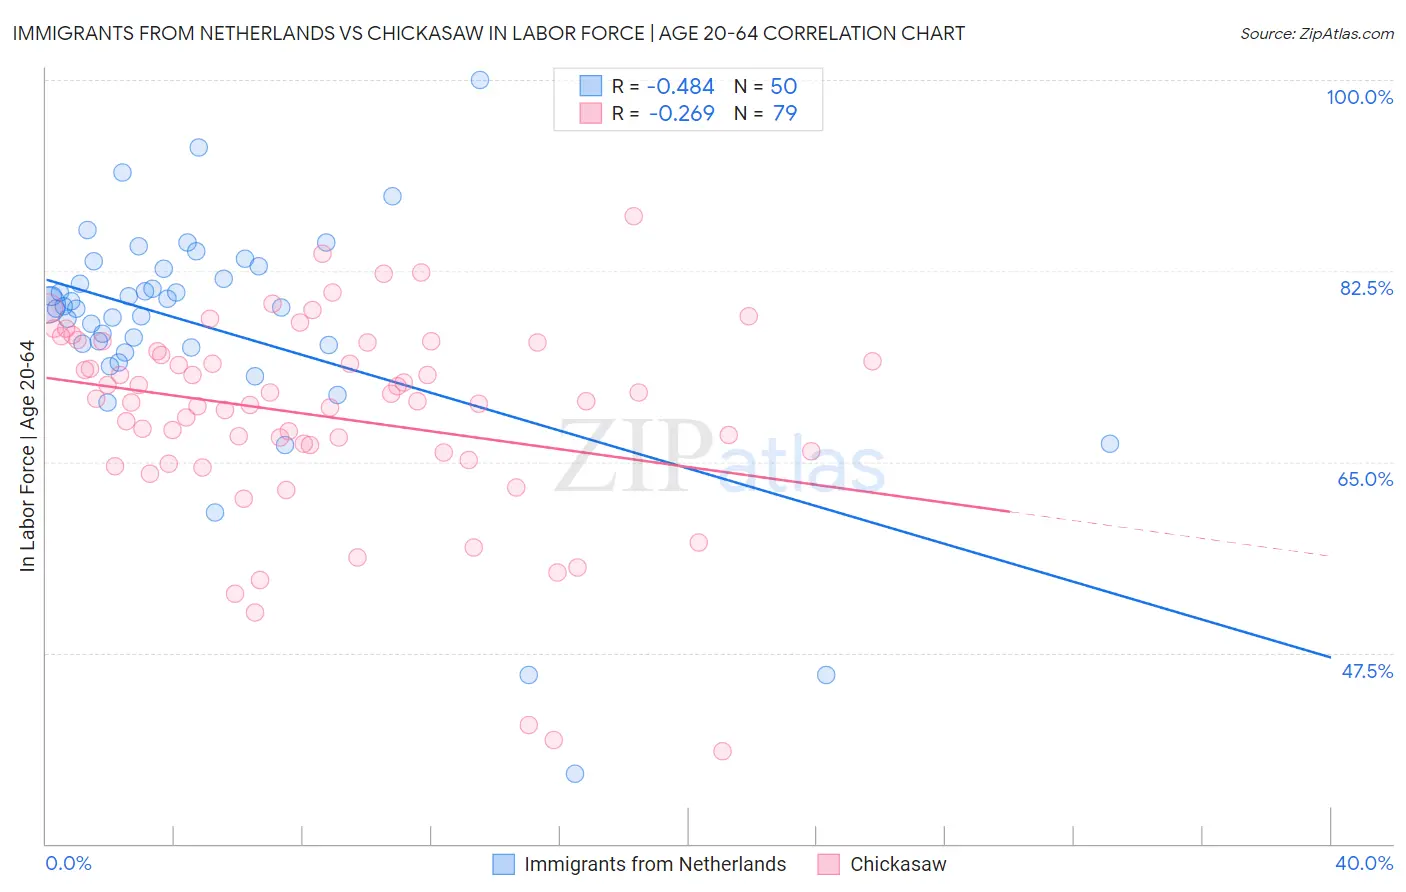
Immigrants from Netherlands vs Chickasaw In Labor Force | Age 20-64 Correlation Chart
The statistical analysis conducted on geographies consisting of 237,882,081 people shows a moderate negative correlation between the proportion of Immigrants from Netherlands and labor force participation rate among population between the ages 20 and 64 in the United States with a correlation coefficient (R) of -0.484 and weighted average of 79.5%. Similarly, the statistical analysis conducted on geographies consisting of 147,722,293 people shows a weak negative correlation between the proportion of Chickasaw and labor force participation rate among population between the ages 20 and 64 in the United States with a correlation coefficient (R) of -0.269 and weighted average of 76.2%, a difference of 4.4%.
In Labor Force | Age 20-64 Correlation Summary
| Measurement | Immigrants from Netherlands | Chickasaw |
| Minimum | 36.4% | 38.5% |
| Maximum | 100.0% | 87.5% |
| Range | 63.6% | 49.0% |
| Mean | 77.2% | 69.2% |
| Median | 79.2% | 70.5% |
| Interquartile 25% (IQ1) | 75.5% | 65.8% |
| Interquartile 75% (IQ3) | 82.7% | 75.9% |
| Interquartile Range (IQR) | 7.2% | 10.1% |
| Standard Deviation (Sample) | 11.1% | 9.4% |
| Standard Deviation (Population) | 11.0% | 9.4% |
Similar Demographics by In Labor Force | Age 20-64
Demographics Similar to Immigrants from Netherlands by In Labor Force | Age 20-64
In terms of in labor force | age 20-64, the demographic groups most similar to Immigrants from Netherlands are Cuban (79.5%, a difference of 0.010%), Australian (79.5%, a difference of 0.010%), Czechoslovakian (79.5%, a difference of 0.010%), Armenian (79.5%, a difference of 0.030%), and Salvadoran (79.5%, a difference of 0.030%).
| Demographics | Rating | Rank | In Labor Force | Age 20-64 |
| Slavs | 54.0 /100 | #170 | Average 79.6% |
| Immigrants | Switzerland | 53.3 /100 | #171 | Average 79.6% |
| Immigrants | Belgium | 53.1 /100 | #172 | Average 79.6% |
| Immigrants | Scotland | 52.4 /100 | #173 | Average 79.6% |
| Syrians | 50.0 /100 | #174 | Average 79.6% |
| Cubans | 46.1 /100 | #175 | Average 79.5% |
| Australians | 46.0 /100 | #176 | Average 79.5% |
| Immigrants | Netherlands | 45.2 /100 | #177 | Average 79.5% |
| Czechoslovakians | 44.3 /100 | #178 | Average 79.5% |
| Armenians | 41.4 /100 | #179 | Average 79.5% |
| Salvadorans | 41.0 /100 | #180 | Average 79.5% |
| Immigrants | Saudi Arabia | 37.7 /100 | #181 | Fair 79.5% |
| Malaysians | 37.1 /100 | #182 | Fair 79.5% |
| Immigrants | Hungary | 36.8 /100 | #183 | Fair 79.5% |
| Finns | 35.9 /100 | #184 | Fair 79.5% |
Demographics Similar to Chickasaw by In Labor Force | Age 20-64
In terms of in labor force | age 20-64, the demographic groups most similar to Chickasaw are Cherokee (76.2%, a difference of 0.040%), Inupiat (76.1%, a difference of 0.16%), Yaqui (76.5%, a difference of 0.44%), Yakama (75.8%, a difference of 0.55%), and Ottawa (76.7%, a difference of 0.63%).
| Demographics | Rating | Rank | In Labor Force | Age 20-64 |
| Blackfeet | 0.0 /100 | #311 | Tragic 77.0% |
| Alaskan Athabascans | 0.0 /100 | #312 | Tragic 76.9% |
| Shoshone | 0.0 /100 | #313 | Tragic 76.8% |
| Blacks/African Americans | 0.0 /100 | #314 | Tragic 76.8% |
| Ottawa | 0.0 /100 | #315 | Tragic 76.7% |
| Yaqui | 0.0 /100 | #316 | Tragic 76.5% |
| Cherokee | 0.0 /100 | #317 | Tragic 76.2% |
| Chickasaw | 0.0 /100 | #318 | Tragic 76.2% |
| Inupiat | 0.0 /100 | #319 | Tragic 76.1% |
| Yakama | 0.0 /100 | #320 | Tragic 75.8% |
| Seminole | 0.0 /100 | #321 | Tragic 75.5% |
| Dutch West Indians | 0.0 /100 | #322 | Tragic 75.5% |
| Cajuns | 0.0 /100 | #323 | Tragic 75.5% |
| Choctaw | 0.0 /100 | #324 | Tragic 75.4% |
| Menominee | 0.0 /100 | #325 | Tragic 75.3% |