Immigrants from the Azores vs New Zealander In Labor Force | Age 20-64
COMPARE
Immigrants from the Azores
New Zealander
In Labor Force | Age 20-64
In Labor Force | Age 20-64 Comparison
Immigrants from the Azores
New Zealanders
77.8%
IN LABOR FORCE | AGE 20-64
0.0/ 100
METRIC RATING
292nd/ 347
METRIC RANK
79.7%
IN LABOR FORCE | AGE 20-64
69.4/ 100
METRIC RATING
154th/ 347
METRIC RANK
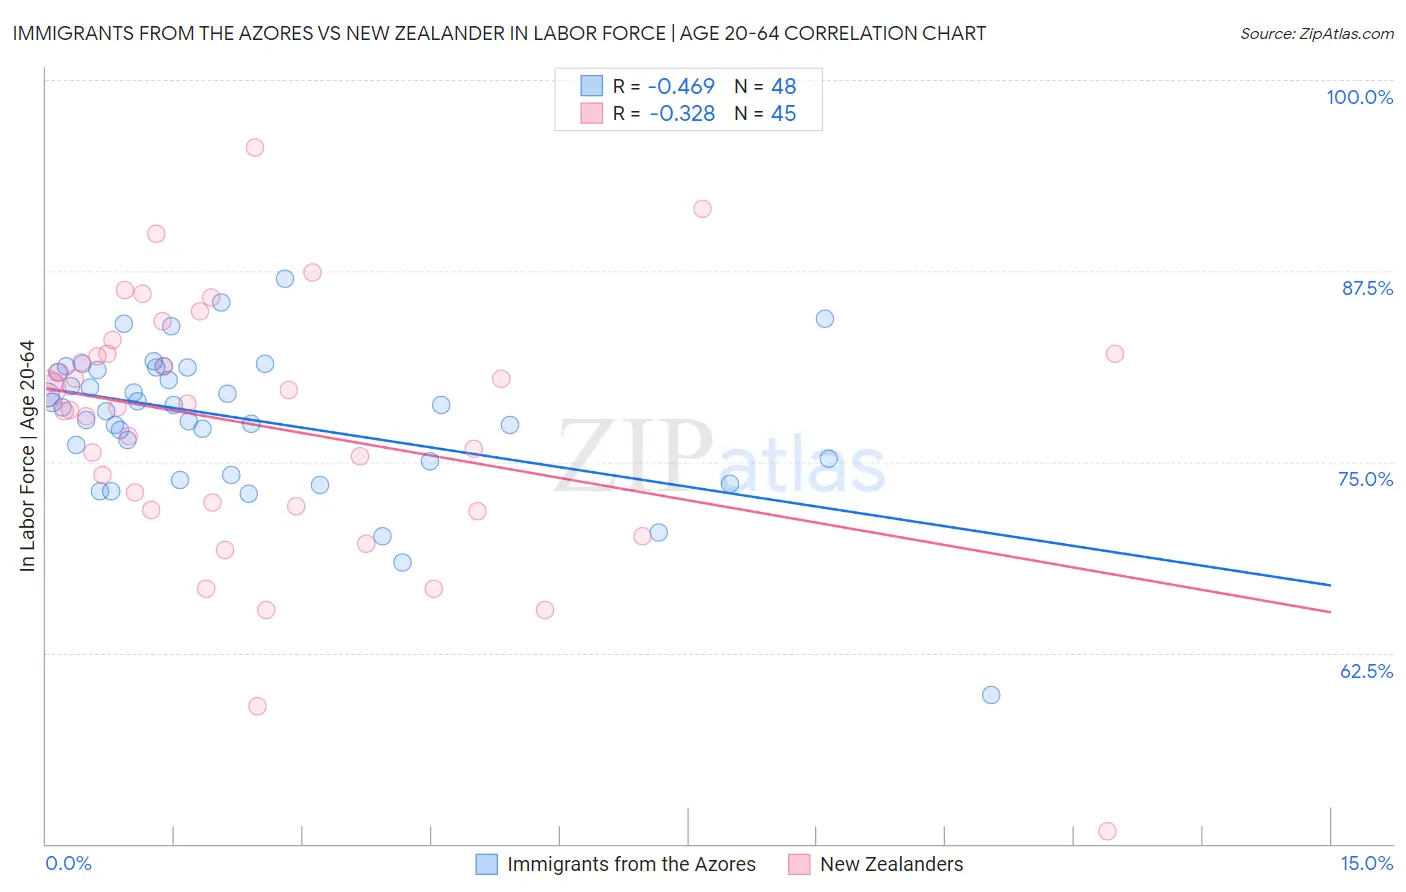
Immigrants from the Azores vs New Zealander In Labor Force | Age 20-64 Correlation Chart
The statistical analysis conducted on geographies consisting of 46,256,974 people shows a moderate negative correlation between the proportion of Immigrants from the Azores and labor force participation rate among population between the ages 20 and 64 in the United States with a correlation coefficient (R) of -0.469 and weighted average of 77.8%. Similarly, the statistical analysis conducted on geographies consisting of 106,923,900 people shows a mild negative correlation between the proportion of New Zealanders and labor force participation rate among population between the ages 20 and 64 in the United States with a correlation coefficient (R) of -0.328 and weighted average of 79.7%, a difference of 2.4%.
In Labor Force | Age 20-64 Correlation Summary
| Measurement | Immigrants from the Azores | New Zealander |
| Minimum | 59.7% | 50.8% |
| Maximum | 87.0% | 95.6% |
| Range | 27.3% | 44.8% |
| Mean | 77.8% | 77.3% |
| Median | 78.6% | 78.6% |
| Interquartile 25% (IQ1) | 75.1% | 72.0% |
| Interquartile 75% (IQ3) | 81.1% | 82.1% |
| Interquartile Range (IQR) | 6.0% | 10.1% |
| Standard Deviation (Sample) | 4.8% | 8.5% |
| Standard Deviation (Population) | 4.8% | 8.4% |
Similar Demographics by In Labor Force | Age 20-64
Demographics Similar to Immigrants from the Azores by In Labor Force | Age 20-64
In terms of in labor force | age 20-64, the demographic groups most similar to Immigrants from the Azores are Delaware (77.8%, a difference of 0.040%), Spanish American (77.8%, a difference of 0.050%), Immigrants from Bangladesh (77.9%, a difference of 0.10%), African (77.9%, a difference of 0.12%), and Immigrants from Central America (77.7%, a difference of 0.12%).
| Demographics | Rating | Rank | In Labor Force | Age 20-64 |
| Osage | 0.0 /100 | #285 | Tragic 78.0% |
| Immigrants | Belize | 0.0 /100 | #286 | Tragic 78.0% |
| Vietnamese | 0.0 /100 | #287 | Tragic 78.0% |
| Hmong | 0.0 /100 | #288 | Tragic 77.9% |
| Africans | 0.0 /100 | #289 | Tragic 77.9% |
| Immigrants | Bangladesh | 0.0 /100 | #290 | Tragic 77.9% |
| Spanish Americans | 0.0 /100 | #291 | Tragic 77.8% |
| Immigrants | Azores | 0.0 /100 | #292 | Tragic 77.8% |
| Delaware | 0.0 /100 | #293 | Tragic 77.8% |
| Immigrants | Central America | 0.0 /100 | #294 | Tragic 77.7% |
| Immigrants | Grenada | 0.0 /100 | #295 | Tragic 77.7% |
| Immigrants | Dominican Republic | 0.0 /100 | #296 | Tragic 77.7% |
| Dominicans | 0.0 /100 | #297 | Tragic 77.7% |
| Cree | 0.0 /100 | #298 | Tragic 77.7% |
| Hispanics or Latinos | 0.0 /100 | #299 | Tragic 77.6% |
Demographics Similar to New Zealanders by In Labor Force | Age 20-64
In terms of in labor force | age 20-64, the demographic groups most similar to New Zealanders are Immigrants from Kazakhstan (79.7%, a difference of 0.0%), Immigrants from South Africa (79.7%, a difference of 0.0%), Senegalese (79.7%, a difference of 0.0%), Immigrants from China (79.7%, a difference of 0.0%), and Immigrants from Northern Europe (79.7%, a difference of 0.020%).
| Demographics | Rating | Rank | In Labor Force | Age 20-64 |
| Immigrants | Philippines | 78.0 /100 | #147 | Good 79.8% |
| Romanians | 77.6 /100 | #148 | Good 79.8% |
| Icelanders | 75.1 /100 | #149 | Good 79.7% |
| Costa Ricans | 72.4 /100 | #150 | Good 79.7% |
| Scandinavians | 72.0 /100 | #151 | Good 79.7% |
| Immigrants | Northern Europe | 72.0 /100 | #152 | Good 79.7% |
| Immigrants | Kazakhstan | 69.5 /100 | #153 | Good 79.7% |
| New Zealanders | 69.4 /100 | #154 | Good 79.7% |
| Immigrants | South Africa | 69.2 /100 | #155 | Good 79.7% |
| Senegalese | 69.1 /100 | #156 | Good 79.7% |
| Immigrants | China | 69.1 /100 | #157 | Good 79.7% |
| Austrians | 67.6 /100 | #158 | Good 79.7% |
| Immigrants | Cuba | 66.7 /100 | #159 | Good 79.7% |
| Moroccans | 66.7 /100 | #160 | Good 79.7% |
| South Africans | 66.2 /100 | #161 | Good 79.7% |