Hispanic or Latino vs Kiowa In Labor Force | Age 35-44
COMPARE
Hispanic or Latino
Kiowa
In Labor Force | Age 35-44
In Labor Force | Age 35-44 Comparison
Hispanics or Latinos
Kiowa
82.1%
IN LABOR FORCE | AGE 35-44
0.0/ 100
METRIC RATING
307th/ 347
METRIC RANK
79.2%
IN LABOR FORCE | AGE 35-44
0.0/ 100
METRIC RATING
333rd/ 347
METRIC RANK
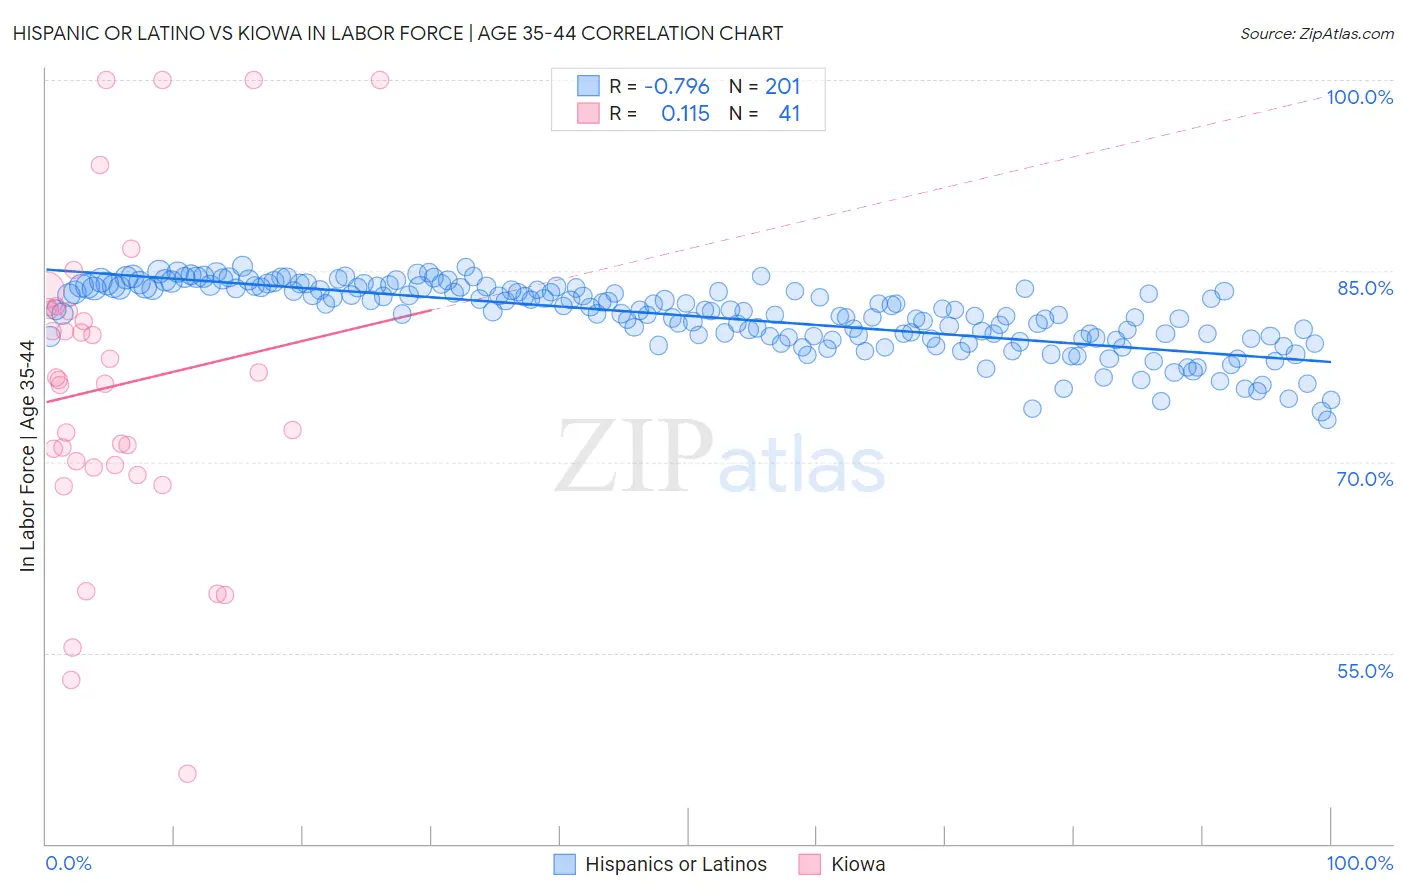
Hispanic or Latino vs Kiowa In Labor Force | Age 35-44 Correlation Chart
The statistical analysis conducted on geographies consisting of 577,755,935 people shows a strong negative correlation between the proportion of Hispanics or Latinos and labor force participation rate among population between the ages 35 and 44 in the United States with a correlation coefficient (R) of -0.796 and weighted average of 82.1%. Similarly, the statistical analysis conducted on geographies consisting of 56,099,396 people shows a poor positive correlation between the proportion of Kiowa and labor force participation rate among population between the ages 35 and 44 in the United States with a correlation coefficient (R) of 0.115 and weighted average of 79.2%, a difference of 3.7%.
In Labor Force | Age 35-44 Correlation Summary
| Measurement | Hispanic or Latino | Kiowa |
| Minimum | 73.3% | 45.5% |
| Maximum | 85.4% | 100.0% |
| Range | 12.1% | 54.5% |
| Mean | 81.5% | 76.0% |
| Median | 81.9% | 76.4% |
| Interquartile 25% (IQ1) | 79.8% | 69.7% |
| Interquartile 75% (IQ3) | 83.7% | 82.0% |
| Interquartile Range (IQR) | 3.9% | 12.4% |
| Standard Deviation (Sample) | 2.7% | 12.5% |
| Standard Deviation (Population) | 2.6% | 12.3% |
Similar Demographics by In Labor Force | Age 35-44
Demographics Similar to Hispanics or Latinos by In Labor Force | Age 35-44
In terms of in labor force | age 35-44, the demographic groups most similar to Hispanics or Latinos are Black/African American (82.2%, a difference of 0.10%), Shoshone (82.2%, a difference of 0.12%), Immigrants from Central America (82.0%, a difference of 0.15%), Cree (82.0%, a difference of 0.15%), and Blackfeet (81.9%, a difference of 0.28%).
| Demographics | Rating | Rank | In Labor Force | Age 35-44 |
| Central American Indians | 0.0 /100 | #300 | Tragic 82.5% |
| Spanish American Indians | 0.0 /100 | #301 | Tragic 82.5% |
| Americans | 0.0 /100 | #302 | Tragic 82.4% |
| Nepalese | 0.0 /100 | #303 | Tragic 82.4% |
| Marshallese | 0.0 /100 | #304 | Tragic 82.4% |
| Shoshone | 0.0 /100 | #305 | Tragic 82.2% |
| Blacks/African Americans | 0.0 /100 | #306 | Tragic 82.2% |
| Hispanics or Latinos | 0.0 /100 | #307 | Tragic 82.1% |
| Immigrants | Central America | 0.0 /100 | #308 | Tragic 82.0% |
| Cree | 0.0 /100 | #309 | Tragic 82.0% |
| Blackfeet | 0.0 /100 | #310 | Tragic 81.9% |
| Colville | 0.0 /100 | #311 | Tragic 81.7% |
| Alaska Natives | 0.0 /100 | #312 | Tragic 81.6% |
| Mexicans | 0.0 /100 | #313 | Tragic 81.6% |
| Cajuns | 0.0 /100 | #314 | Tragic 81.5% |
Demographics Similar to Kiowa by In Labor Force | Age 35-44
In terms of in labor force | age 35-44, the demographic groups most similar to Kiowa are Yakama (79.0%, a difference of 0.29%), Ute (79.4%, a difference of 0.33%), Houma (79.5%, a difference of 0.39%), Native/Alaskan (78.9%, a difference of 0.40%), and Cheyenne (79.5%, a difference of 0.41%).
| Demographics | Rating | Rank | In Labor Force | Age 35-44 |
| Seminole | 0.0 /100 | #326 | Tragic 80.4% |
| Sioux | 0.0 /100 | #327 | Tragic 80.2% |
| Creek | 0.0 /100 | #328 | Tragic 80.0% |
| Menominee | 0.0 /100 | #329 | Tragic 79.7% |
| Cheyenne | 0.0 /100 | #330 | Tragic 79.5% |
| Houma | 0.0 /100 | #331 | Tragic 79.5% |
| Ute | 0.0 /100 | #332 | Tragic 79.4% |
| Kiowa | 0.0 /100 | #333 | Tragic 79.2% |
| Yakama | 0.0 /100 | #334 | Tragic 79.0% |
| Natives/Alaskans | 0.0 /100 | #335 | Tragic 78.9% |
| Arapaho | 0.0 /100 | #336 | Tragic 78.1% |
| Apache | 0.0 /100 | #337 | Tragic 77.9% |
| Pueblo | 0.0 /100 | #338 | Tragic 77.4% |
| Yup'ik | 0.0 /100 | #339 | Tragic 77.3% |
| Lumbee | 0.0 /100 | #340 | Tragic 77.0% |