Hispanic or Latino vs Welsh In Labor Force | Age 35-44
COMPARE
Hispanic or Latino
Welsh
In Labor Force | Age 35-44
In Labor Force | Age 35-44 Comparison
Hispanics or Latinos
Welsh
82.1%
IN LABOR FORCE | AGE 35-44
0.0/ 100
METRIC RATING
307th/ 347
METRIC RANK
84.0%
IN LABOR FORCE | AGE 35-44
5.3/ 100
METRIC RATING
228th/ 347
METRIC RANK
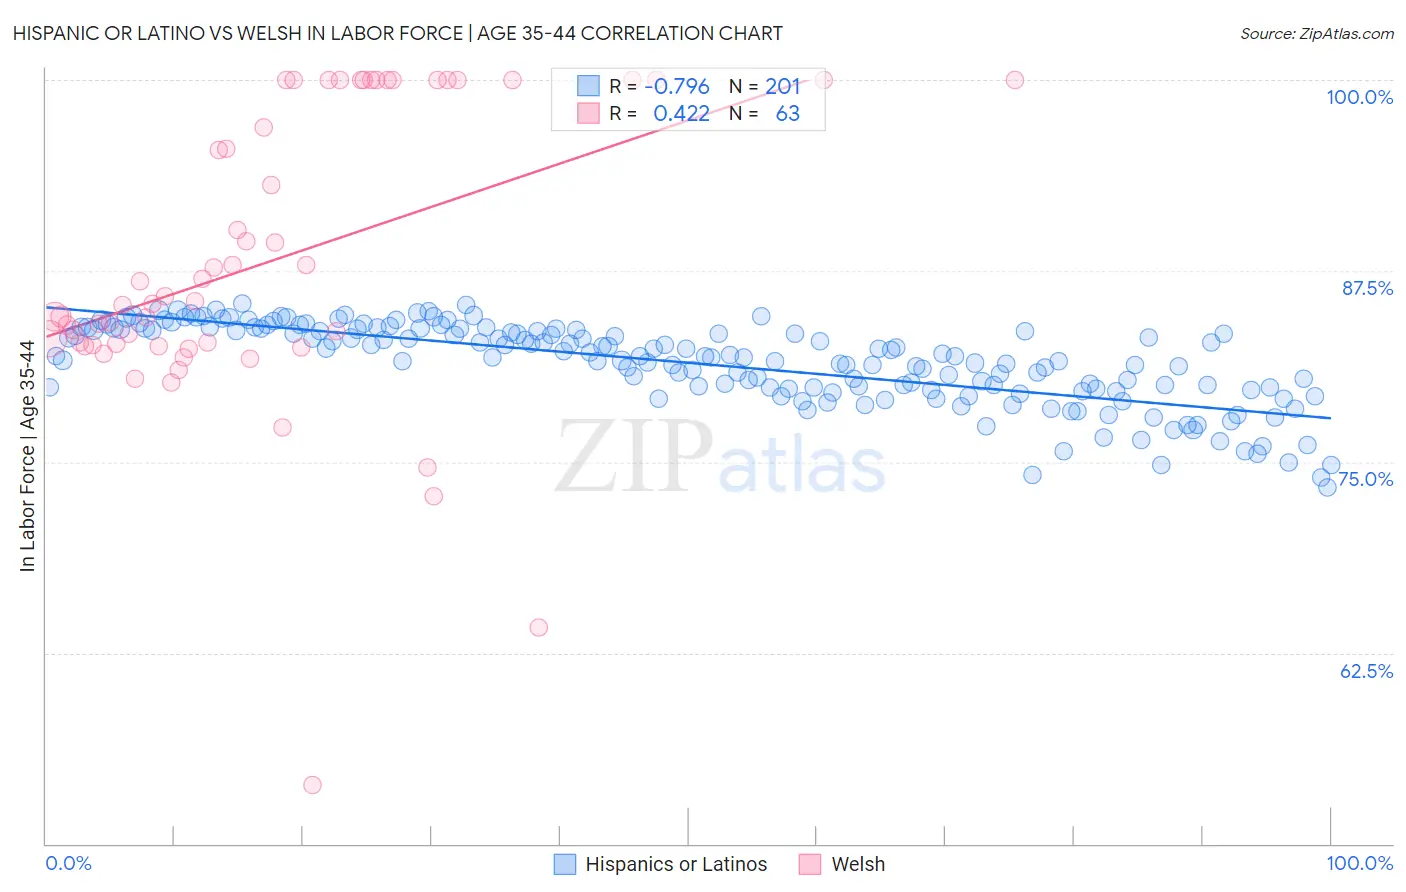
Hispanic or Latino vs Welsh In Labor Force | Age 35-44 Correlation Chart
The statistical analysis conducted on geographies consisting of 577,755,935 people shows a strong negative correlation between the proportion of Hispanics or Latinos and labor force participation rate among population between the ages 35 and 44 in the United States with a correlation coefficient (R) of -0.796 and weighted average of 82.1%. Similarly, the statistical analysis conducted on geographies consisting of 528,172,849 people shows a moderate positive correlation between the proportion of Welsh and labor force participation rate among population between the ages 35 and 44 in the United States with a correlation coefficient (R) of 0.422 and weighted average of 84.0%, a difference of 2.3%.
In Labor Force | Age 35-44 Correlation Summary
| Measurement | Hispanic or Latino | Welsh |
| Minimum | 73.3% | 53.9% |
| Maximum | 85.4% | 100.0% |
| Range | 12.1% | 46.1% |
| Mean | 81.5% | 88.2% |
| Median | 81.9% | 85.5% |
| Interquartile 25% (IQ1) | 79.8% | 82.7% |
| Interquartile 75% (IQ3) | 83.7% | 100.0% |
| Interquartile Range (IQR) | 3.9% | 17.3% |
| Standard Deviation (Sample) | 2.7% | 9.7% |
| Standard Deviation (Population) | 2.6% | 9.6% |
Similar Demographics by In Labor Force | Age 35-44
Demographics Similar to Hispanics or Latinos by In Labor Force | Age 35-44
In terms of in labor force | age 35-44, the demographic groups most similar to Hispanics or Latinos are Black/African American (82.2%, a difference of 0.10%), Shoshone (82.2%, a difference of 0.12%), Immigrants from Central America (82.0%, a difference of 0.15%), Cree (82.0%, a difference of 0.15%), and Blackfeet (81.9%, a difference of 0.28%).
| Demographics | Rating | Rank | In Labor Force | Age 35-44 |
| Central American Indians | 0.0 /100 | #300 | Tragic 82.5% |
| Spanish American Indians | 0.0 /100 | #301 | Tragic 82.5% |
| Americans | 0.0 /100 | #302 | Tragic 82.4% |
| Nepalese | 0.0 /100 | #303 | Tragic 82.4% |
| Marshallese | 0.0 /100 | #304 | Tragic 82.4% |
| Shoshone | 0.0 /100 | #305 | Tragic 82.2% |
| Blacks/African Americans | 0.0 /100 | #306 | Tragic 82.2% |
| Hispanics or Latinos | 0.0 /100 | #307 | Tragic 82.1% |
| Immigrants | Central America | 0.0 /100 | #308 | Tragic 82.0% |
| Cree | 0.0 /100 | #309 | Tragic 82.0% |
| Blackfeet | 0.0 /100 | #310 | Tragic 81.9% |
| Colville | 0.0 /100 | #311 | Tragic 81.7% |
| Alaska Natives | 0.0 /100 | #312 | Tragic 81.6% |
| Mexicans | 0.0 /100 | #313 | Tragic 81.6% |
| Cajuns | 0.0 /100 | #314 | Tragic 81.5% |
Demographics Similar to Welsh by In Labor Force | Age 35-44
In terms of in labor force | age 35-44, the demographic groups most similar to Welsh are Panamanian (84.0%, a difference of 0.0%), British West Indian (84.0%, a difference of 0.0%), U.S. Virgin Islander (84.0%, a difference of 0.020%), Immigrants from Burma/Myanmar (84.0%, a difference of 0.020%), and Immigrants from Thailand (84.0%, a difference of 0.020%).
| Demographics | Rating | Rank | In Labor Force | Age 35-44 |
| Icelanders | 6.7 /100 | #221 | Tragic 84.0% |
| Assyrians/Chaldeans/Syriacs | 6.6 /100 | #222 | Tragic 84.0% |
| Immigrants | Panama | 6.4 /100 | #223 | Tragic 84.0% |
| U.S. Virgin Islanders | 6.1 /100 | #224 | Tragic 84.0% |
| Immigrants | Burma/Myanmar | 6.1 /100 | #225 | Tragic 84.0% |
| Panamanians | 5.4 /100 | #226 | Tragic 84.0% |
| British West Indians | 5.3 /100 | #227 | Tragic 84.0% |
| Welsh | 5.3 /100 | #228 | Tragic 84.0% |
| Immigrants | Thailand | 4.7 /100 | #229 | Tragic 84.0% |
| Immigrants | Iraq | 3.7 /100 | #230 | Tragic 83.9% |
| Scottish | 3.2 /100 | #231 | Tragic 83.9% |
| Native Hawaiians | 3.0 /100 | #232 | Tragic 83.9% |
| Immigrants | Germany | 2.8 /100 | #233 | Tragic 83.9% |
| Immigrants | Oceania | 2.6 /100 | #234 | Tragic 83.9% |
| Immigrants | Syria | 2.5 /100 | #235 | Tragic 83.9% |