Hispanic or Latino vs Kiowa GED/Equivalency
COMPARE
Hispanic or Latino
Kiowa
GED/Equivalency
GED/Equivalency Comparison
Hispanics or Latinos
Kiowa
79.1%
GED/EQUIVALENCY
0.0/ 100
METRIC RATING
328th/ 347
METRIC RANK
83.1%
GED/EQUIVALENCY
0.2/ 100
METRIC RATING
266th/ 347
METRIC RANK
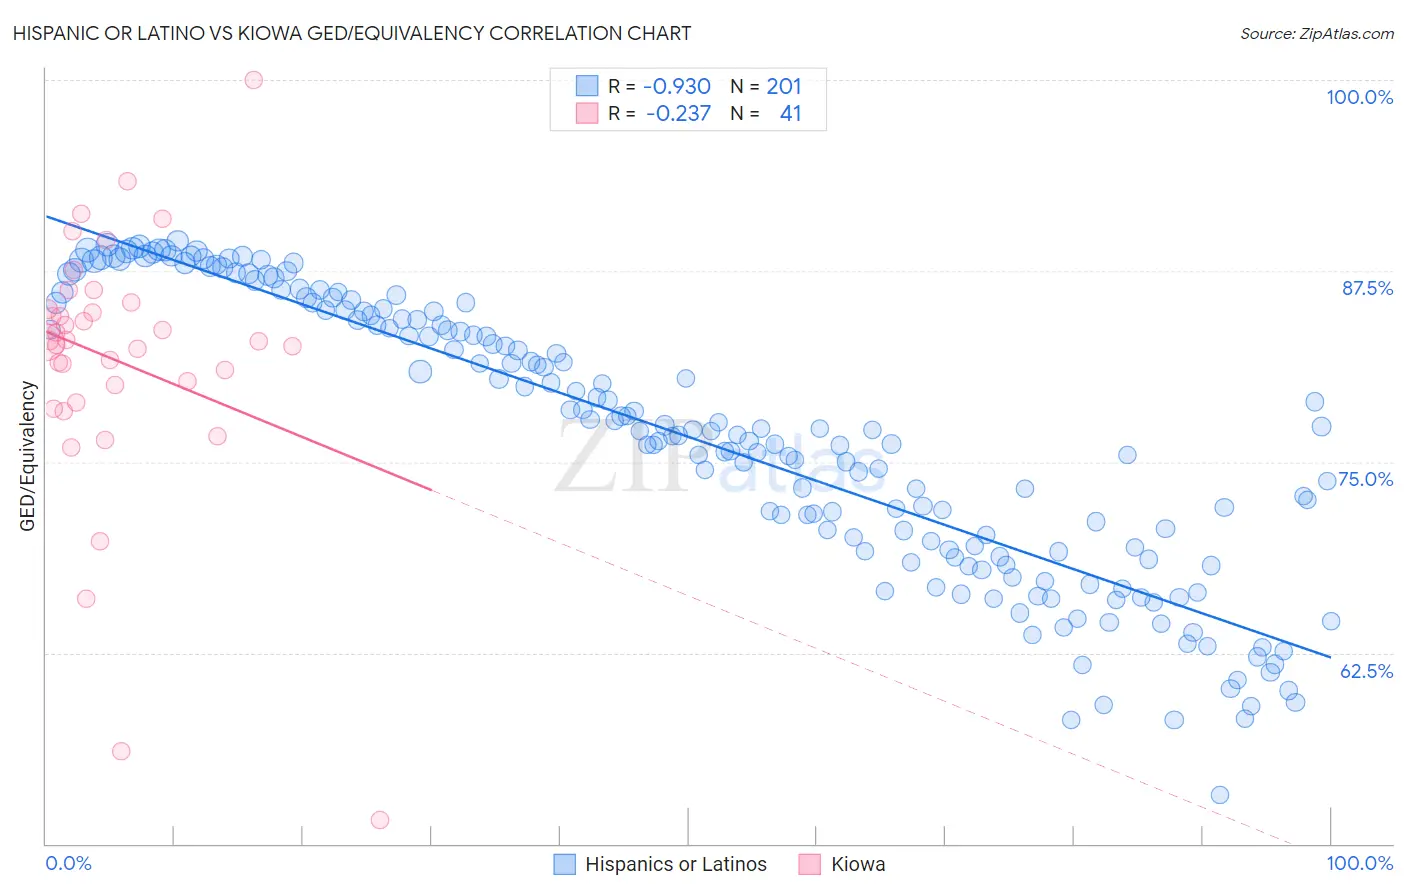
Hispanic or Latino vs Kiowa GED/Equivalency Correlation Chart
The statistical analysis conducted on geographies consisting of 578,611,870 people shows a near-perfect negative correlation between the proportion of Hispanics or Latinos and percentage of population with at least ged/equivalency education in the United States with a correlation coefficient (R) of -0.930 and weighted average of 79.1%. Similarly, the statistical analysis conducted on geographies consisting of 56,101,840 people shows a weak negative correlation between the proportion of Kiowa and percentage of population with at least ged/equivalency education in the United States with a correlation coefficient (R) of -0.237 and weighted average of 83.1%, a difference of 5.0%.
GED/Equivalency Correlation Summary
| Measurement | Hispanic or Latino | Kiowa |
| Minimum | 53.2% | 51.6% |
| Maximum | 89.5% | 100.0% |
| Range | 36.2% | 48.4% |
| Mean | 76.6% | 81.7% |
| Median | 77.1% | 82.9% |
| Interquartile 25% (IQ1) | 69.1% | 79.5% |
| Interquartile 75% (IQ3) | 84.9% | 85.2% |
| Interquartile Range (IQR) | 15.7% | 5.8% |
| Standard Deviation (Sample) | 9.0% | 8.7% |
| Standard Deviation (Population) | 9.0% | 8.6% |
Similar Demographics by GED/Equivalency
Demographics Similar to Hispanics or Latinos by GED/Equivalency
In terms of ged/equivalency, the demographic groups most similar to Hispanics or Latinos are Dominican (79.1%, a difference of 0.050%), Central American (79.2%, a difference of 0.10%), Yuman (79.2%, a difference of 0.13%), Immigrants from Cabo Verde (78.9%, a difference of 0.20%), and Honduran (79.3%, a difference of 0.22%).
| Demographics | Rating | Rank | GED/Equivalency |
| Yup'ik | 0.0 /100 | #321 | Tragic 80.0% |
| Lumbee | 0.0 /100 | #322 | Tragic 80.0% |
| Immigrants | Nicaragua | 0.0 /100 | #323 | Tragic 79.9% |
| Mexican American Indians | 0.0 /100 | #324 | Tragic 79.4% |
| Hondurans | 0.0 /100 | #325 | Tragic 79.3% |
| Yuman | 0.0 /100 | #326 | Tragic 79.2% |
| Central Americans | 0.0 /100 | #327 | Tragic 79.2% |
| Hispanics or Latinos | 0.0 /100 | #328 | Tragic 79.1% |
| Dominicans | 0.0 /100 | #329 | Tragic 79.1% |
| Immigrants | Cabo Verde | 0.0 /100 | #330 | Tragic 78.9% |
| Immigrants | Honduras | 0.0 /100 | #331 | Tragic 78.7% |
| Immigrants | Azores | 0.0 /100 | #332 | Tragic 78.7% |
| Salvadorans | 0.0 /100 | #333 | Tragic 78.6% |
| Guatemalans | 0.0 /100 | #334 | Tragic 78.5% |
| Immigrants | Latin America | 0.0 /100 | #335 | Tragic 78.5% |
Demographics Similar to Kiowa by GED/Equivalency
In terms of ged/equivalency, the demographic groups most similar to Kiowa are Bangladeshi (83.1%, a difference of 0.010%), West Indian (83.1%, a difference of 0.010%), Trinidadian and Tobagonian (83.0%, a difference of 0.020%), Immigrants from Congo (83.1%, a difference of 0.030%), and Inupiat (83.1%, a difference of 0.040%).
| Demographics | Rating | Rank | GED/Equivalency |
| Immigrants | Vietnam | 0.3 /100 | #259 | Tragic 83.2% |
| Choctaw | 0.3 /100 | #260 | Tragic 83.1% |
| Inupiat | 0.2 /100 | #261 | Tragic 83.1% |
| Immigrants | Armenia | 0.2 /100 | #262 | Tragic 83.1% |
| Immigrants | Congo | 0.2 /100 | #263 | Tragic 83.1% |
| Bangladeshis | 0.2 /100 | #264 | Tragic 83.1% |
| West Indians | 0.2 /100 | #265 | Tragic 83.1% |
| Kiowa | 0.2 /100 | #266 | Tragic 83.1% |
| Trinidadians and Tobagonians | 0.2 /100 | #267 | Tragic 83.0% |
| Immigrants | Burma/Myanmar | 0.2 /100 | #268 | Tragic 83.0% |
| Hopi | 0.2 /100 | #269 | Tragic 83.0% |
| Immigrants | Jamaica | 0.2 /100 | #270 | Tragic 82.9% |
| U.S. Virgin Islanders | 0.2 /100 | #271 | Tragic 82.9% |
| Barbadians | 0.1 /100 | #272 | Tragic 82.9% |
| Pennsylvania Germans | 0.1 /100 | #273 | Tragic 82.9% |