New Zealander vs Kiowa In Labor Force | Age 35-44
COMPARE
New Zealander
Kiowa
In Labor Force | Age 35-44
In Labor Force | Age 35-44 Comparison
New Zealanders
Kiowa
84.1%
IN LABOR FORCE | AGE 35-44
16.2/ 100
METRIC RATING
210th/ 347
METRIC RANK
79.2%
IN LABOR FORCE | AGE 35-44
0.0/ 100
METRIC RATING
333rd/ 347
METRIC RANK
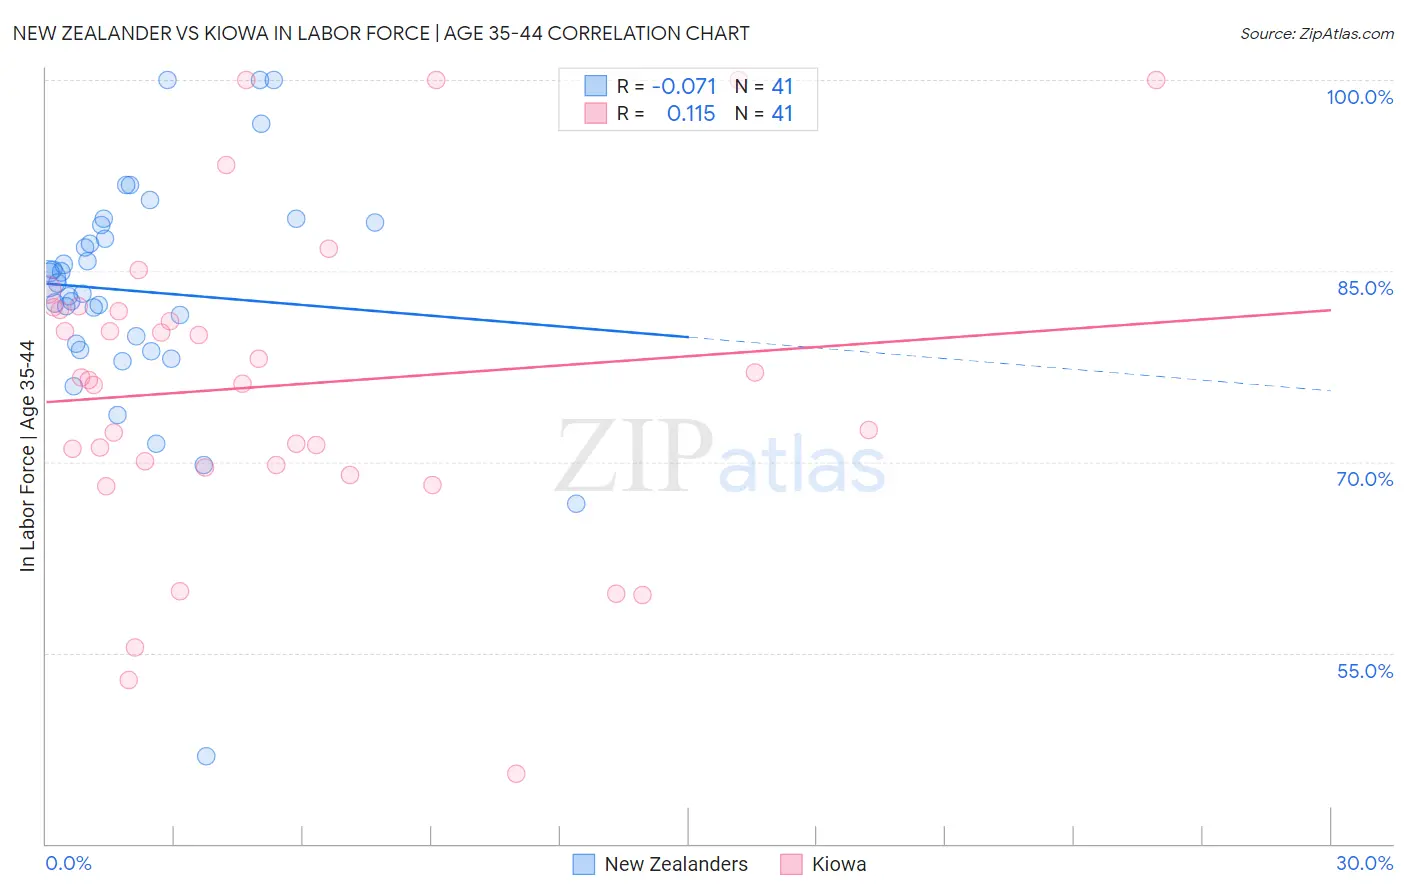
New Zealander vs Kiowa In Labor Force | Age 35-44 Correlation Chart
The statistical analysis conducted on geographies consisting of 106,898,778 people shows a slight negative correlation between the proportion of New Zealanders and labor force participation rate among population between the ages 35 and 44 in the United States with a correlation coefficient (R) of -0.071 and weighted average of 84.1%. Similarly, the statistical analysis conducted on geographies consisting of 56,099,396 people shows a poor positive correlation between the proportion of Kiowa and labor force participation rate among population between the ages 35 and 44 in the United States with a correlation coefficient (R) of 0.115 and weighted average of 79.2%, a difference of 6.3%.
In Labor Force | Age 35-44 Correlation Summary
| Measurement | New Zealander | Kiowa |
| Minimum | 46.9% | 45.5% |
| Maximum | 100.0% | 100.0% |
| Range | 53.1% | 54.5% |
| Mean | 83.4% | 76.0% |
| Median | 84.0% | 76.4% |
| Interquartile 25% (IQ1) | 79.0% | 69.7% |
| Interquartile 75% (IQ3) | 88.7% | 82.0% |
| Interquartile Range (IQR) | 9.7% | 12.4% |
| Standard Deviation (Sample) | 9.5% | 12.5% |
| Standard Deviation (Population) | 9.4% | 12.3% |
Similar Demographics by In Labor Force | Age 35-44
Demographics Similar to New Zealanders by In Labor Force | Age 35-44
In terms of in labor force | age 35-44, the demographic groups most similar to New Zealanders are Swiss (84.2%, a difference of 0.010%), Immigrants from Ecuador (84.1%, a difference of 0.010%), Immigrants from North America (84.2%, a difference of 0.020%), Laotian (84.2%, a difference of 0.030%), and Israeli (84.1%, a difference of 0.030%).
| Demographics | Rating | Rank | In Labor Force | Age 35-44 |
| Immigrants | South Eastern Asia | 22.4 /100 | #203 | Fair 84.2% |
| Canadians | 19.9 /100 | #204 | Poor 84.2% |
| Immigrants | Canada | 19.6 /100 | #205 | Poor 84.2% |
| Immigrants | Costa Rica | 19.5 /100 | #206 | Poor 84.2% |
| Laotians | 19.0 /100 | #207 | Poor 84.2% |
| Immigrants | North America | 18.1 /100 | #208 | Poor 84.2% |
| Swiss | 17.4 /100 | #209 | Poor 84.2% |
| New Zealanders | 16.2 /100 | #210 | Poor 84.1% |
| Immigrants | Ecuador | 15.2 /100 | #211 | Poor 84.1% |
| Israelis | 14.0 /100 | #212 | Poor 84.1% |
| Bangladeshis | 13.7 /100 | #213 | Poor 84.1% |
| Immigrants | Barbados | 13.2 /100 | #214 | Poor 84.1% |
| Europeans | 12.2 /100 | #215 | Poor 84.1% |
| Nicaraguans | 12.1 /100 | #216 | Poor 84.1% |
| Immigrants | Norway | 11.7 /100 | #217 | Poor 84.1% |
Demographics Similar to Kiowa by In Labor Force | Age 35-44
In terms of in labor force | age 35-44, the demographic groups most similar to Kiowa are Yakama (79.0%, a difference of 0.29%), Ute (79.4%, a difference of 0.33%), Houma (79.5%, a difference of 0.39%), Native/Alaskan (78.9%, a difference of 0.40%), and Cheyenne (79.5%, a difference of 0.41%).
| Demographics | Rating | Rank | In Labor Force | Age 35-44 |
| Seminole | 0.0 /100 | #326 | Tragic 80.4% |
| Sioux | 0.0 /100 | #327 | Tragic 80.2% |
| Creek | 0.0 /100 | #328 | Tragic 80.0% |
| Menominee | 0.0 /100 | #329 | Tragic 79.7% |
| Cheyenne | 0.0 /100 | #330 | Tragic 79.5% |
| Houma | 0.0 /100 | #331 | Tragic 79.5% |
| Ute | 0.0 /100 | #332 | Tragic 79.4% |
| Kiowa | 0.0 /100 | #333 | Tragic 79.2% |
| Yakama | 0.0 /100 | #334 | Tragic 79.0% |
| Natives/Alaskans | 0.0 /100 | #335 | Tragic 78.9% |
| Arapaho | 0.0 /100 | #336 | Tragic 78.1% |
| Apache | 0.0 /100 | #337 | Tragic 77.9% |
| Pueblo | 0.0 /100 | #338 | Tragic 77.4% |
| Yup'ik | 0.0 /100 | #339 | Tragic 77.3% |
| Lumbee | 0.0 /100 | #340 | Tragic 77.0% |