Hispanic or Latino vs Carpatho Rusyn In Labor Force | Age 35-44
COMPARE
Hispanic or Latino
Carpatho Rusyn
In Labor Force | Age 35-44
In Labor Force | Age 35-44 Comparison
Hispanics or Latinos
Carpatho Rusyns
82.1%
IN LABOR FORCE | AGE 35-44
0.0/ 100
METRIC RATING
307th/ 347
METRIC RANK
85.6%
IN LABOR FORCE | AGE 35-44
100.0/ 100
METRIC RATING
18th/ 347
METRIC RANK
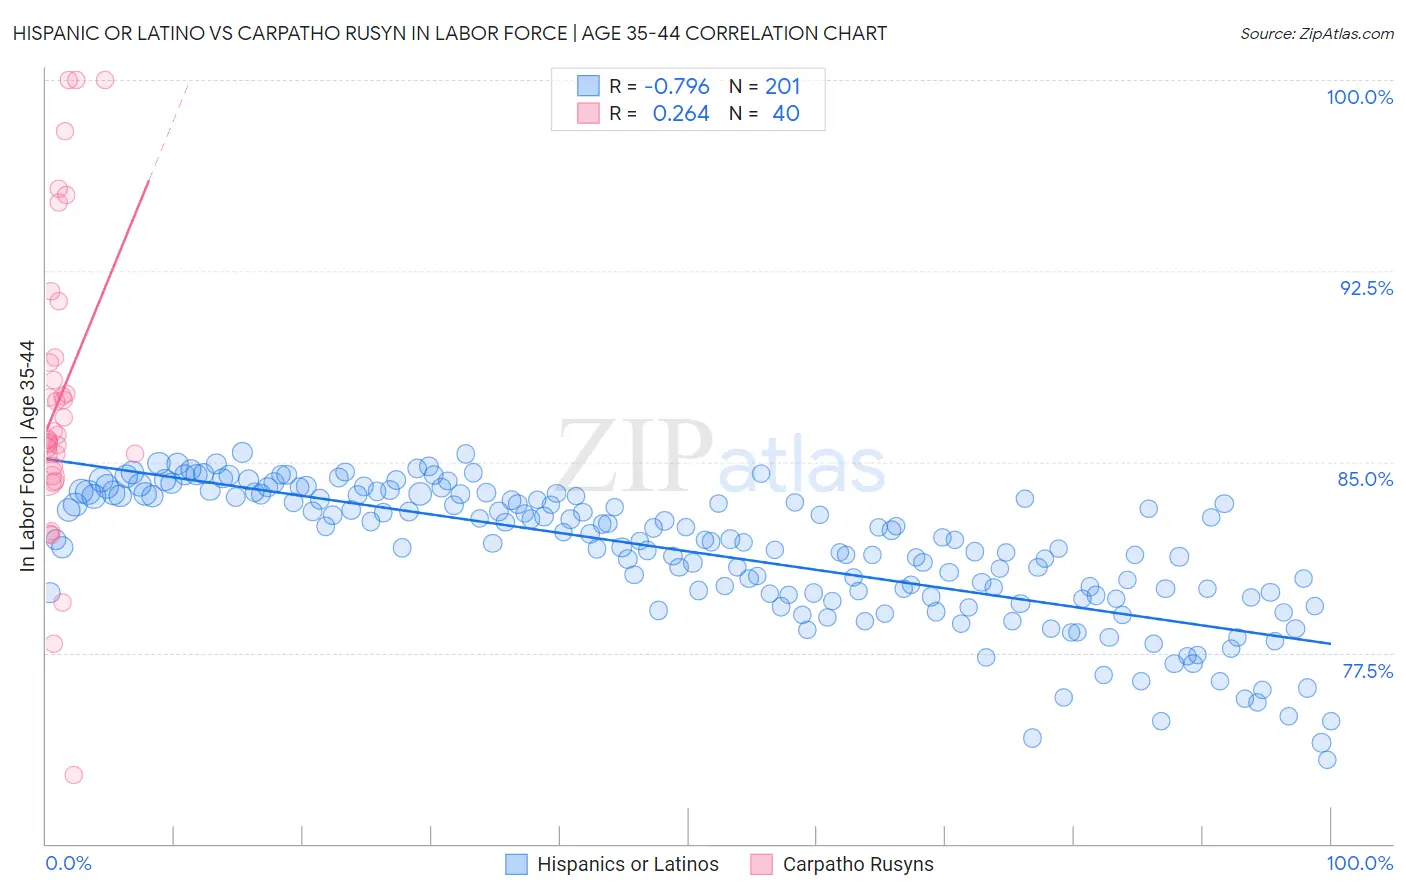
Hispanic or Latino vs Carpatho Rusyn In Labor Force | Age 35-44 Correlation Chart
The statistical analysis conducted on geographies consisting of 577,755,935 people shows a strong negative correlation between the proportion of Hispanics or Latinos and labor force participation rate among population between the ages 35 and 44 in the United States with a correlation coefficient (R) of -0.796 and weighted average of 82.1%. Similarly, the statistical analysis conducted on geographies consisting of 58,868,211 people shows a weak positive correlation between the proportion of Carpatho Rusyns and labor force participation rate among population between the ages 35 and 44 in the United States with a correlation coefficient (R) of 0.264 and weighted average of 85.6%, a difference of 4.2%.
In Labor Force | Age 35-44 Correlation Summary
| Measurement | Hispanic or Latino | Carpatho Rusyn |
| Minimum | 73.3% | 72.7% |
| Maximum | 85.4% | 100.0% |
| Range | 12.1% | 27.3% |
| Mean | 81.5% | 87.5% |
| Median | 81.9% | 86.0% |
| Interquartile 25% (IQ1) | 79.8% | 84.6% |
| Interquartile 75% (IQ3) | 83.7% | 89.0% |
| Interquartile Range (IQR) | 3.9% | 4.4% |
| Standard Deviation (Sample) | 2.7% | 5.9% |
| Standard Deviation (Population) | 2.6% | 5.8% |
Similar Demographics by In Labor Force | Age 35-44
Demographics Similar to Hispanics or Latinos by In Labor Force | Age 35-44
In terms of in labor force | age 35-44, the demographic groups most similar to Hispanics or Latinos are Black/African American (82.2%, a difference of 0.10%), Shoshone (82.2%, a difference of 0.12%), Immigrants from Central America (82.0%, a difference of 0.15%), Cree (82.0%, a difference of 0.15%), and Blackfeet (81.9%, a difference of 0.28%).
| Demographics | Rating | Rank | In Labor Force | Age 35-44 |
| Central American Indians | 0.0 /100 | #300 | Tragic 82.5% |
| Spanish American Indians | 0.0 /100 | #301 | Tragic 82.5% |
| Americans | 0.0 /100 | #302 | Tragic 82.4% |
| Nepalese | 0.0 /100 | #303 | Tragic 82.4% |
| Marshallese | 0.0 /100 | #304 | Tragic 82.4% |
| Shoshone | 0.0 /100 | #305 | Tragic 82.2% |
| Blacks/African Americans | 0.0 /100 | #306 | Tragic 82.2% |
| Hispanics or Latinos | 0.0 /100 | #307 | Tragic 82.1% |
| Immigrants | Central America | 0.0 /100 | #308 | Tragic 82.0% |
| Cree | 0.0 /100 | #309 | Tragic 82.0% |
| Blackfeet | 0.0 /100 | #310 | Tragic 81.9% |
| Colville | 0.0 /100 | #311 | Tragic 81.7% |
| Alaska Natives | 0.0 /100 | #312 | Tragic 81.6% |
| Mexicans | 0.0 /100 | #313 | Tragic 81.6% |
| Cajuns | 0.0 /100 | #314 | Tragic 81.5% |
Demographics Similar to Carpatho Rusyns by In Labor Force | Age 35-44
In terms of in labor force | age 35-44, the demographic groups most similar to Carpatho Rusyns are Immigrants from North Macedonia (85.6%, a difference of 0.0%), Slovene (85.6%, a difference of 0.0%), Norwegian (85.6%, a difference of 0.050%), Immigrants from Ireland (85.6%, a difference of 0.050%), and Immigrants from Serbia (85.5%, a difference of 0.050%).
| Demographics | Rating | Rank | In Labor Force | Age 35-44 |
| Immigrants | Cameroon | 100.0 /100 | #11 | Exceptional 85.8% |
| Liberians | 100.0 /100 | #12 | Exceptional 85.7% |
| Somalis | 100.0 /100 | #13 | Exceptional 85.6% |
| Immigrants | Somalia | 100.0 /100 | #14 | Exceptional 85.6% |
| Norwegians | 100.0 /100 | #15 | Exceptional 85.6% |
| Immigrants | Ireland | 100.0 /100 | #16 | Exceptional 85.6% |
| Immigrants | North Macedonia | 100.0 /100 | #17 | Exceptional 85.6% |
| Carpatho Rusyns | 100.0 /100 | #18 | Exceptional 85.6% |
| Slovenes | 100.0 /100 | #19 | Exceptional 85.6% |
| Immigrants | Serbia | 100.0 /100 | #20 | Exceptional 85.5% |
| Bulgarians | 100.0 /100 | #21 | Exceptional 85.5% |
| Immigrants | Bosnia and Herzegovina | 100.0 /100 | #22 | Exceptional 85.4% |
| Immigrants | Eastern Africa | 100.0 /100 | #23 | Exceptional 85.4% |
| Latvians | 99.9 /100 | #24 | Exceptional 85.4% |
| Paraguayans | 99.9 /100 | #25 | Exceptional 85.4% |