Hispanic or Latino vs Kenyan In Labor Force | Age 35-44
COMPARE
Hispanic or Latino
Kenyan
In Labor Force | Age 35-44
In Labor Force | Age 35-44 Comparison
Hispanics or Latinos
Kenyans
82.1%
IN LABOR FORCE | AGE 35-44
0.0/ 100
METRIC RATING
307th/ 347
METRIC RANK
85.2%
IN LABOR FORCE | AGE 35-44
99.8/ 100
METRIC RATING
37th/ 347
METRIC RANK
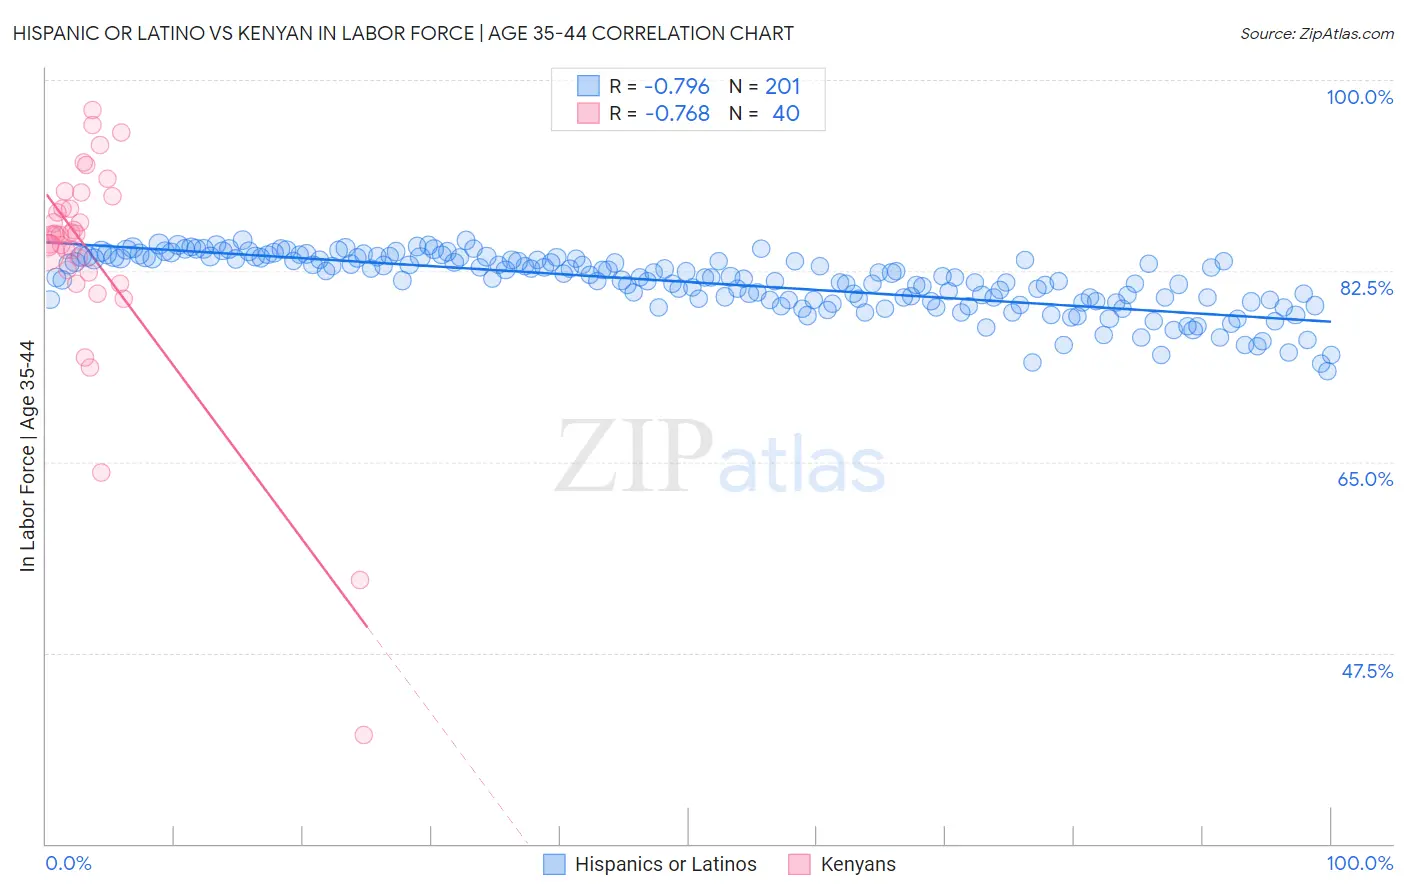
Hispanic or Latino vs Kenyan In Labor Force | Age 35-44 Correlation Chart
The statistical analysis conducted on geographies consisting of 577,755,935 people shows a strong negative correlation between the proportion of Hispanics or Latinos and labor force participation rate among population between the ages 35 and 44 in the United States with a correlation coefficient (R) of -0.796 and weighted average of 82.1%. Similarly, the statistical analysis conducted on geographies consisting of 168,197,384 people shows a strong negative correlation between the proportion of Kenyans and labor force participation rate among population between the ages 35 and 44 in the United States with a correlation coefficient (R) of -0.768 and weighted average of 85.2%, a difference of 3.8%.
In Labor Force | Age 35-44 Correlation Summary
| Measurement | Hispanic or Latino | Kenyan |
| Minimum | 73.3% | 40.0% |
| Maximum | 85.4% | 97.2% |
| Range | 12.1% | 57.2% |
| Mean | 81.5% | 83.8% |
| Median | 81.9% | 85.8% |
| Interquartile 25% (IQ1) | 79.8% | 82.5% |
| Interquartile 75% (IQ3) | 83.7% | 88.8% |
| Interquartile Range (IQR) | 3.9% | 6.3% |
| Standard Deviation (Sample) | 2.7% | 10.6% |
| Standard Deviation (Population) | 2.6% | 10.5% |
Similar Demographics by In Labor Force | Age 35-44
Demographics Similar to Hispanics or Latinos by In Labor Force | Age 35-44
In terms of in labor force | age 35-44, the demographic groups most similar to Hispanics or Latinos are Black/African American (82.2%, a difference of 0.10%), Shoshone (82.2%, a difference of 0.12%), Immigrants from Central America (82.0%, a difference of 0.15%), Cree (82.0%, a difference of 0.15%), and Blackfeet (81.9%, a difference of 0.28%).
| Demographics | Rating | Rank | In Labor Force | Age 35-44 |
| Central American Indians | 0.0 /100 | #300 | Tragic 82.5% |
| Spanish American Indians | 0.0 /100 | #301 | Tragic 82.5% |
| Americans | 0.0 /100 | #302 | Tragic 82.4% |
| Nepalese | 0.0 /100 | #303 | Tragic 82.4% |
| Marshallese | 0.0 /100 | #304 | Tragic 82.4% |
| Shoshone | 0.0 /100 | #305 | Tragic 82.2% |
| Blacks/African Americans | 0.0 /100 | #306 | Tragic 82.2% |
| Hispanics or Latinos | 0.0 /100 | #307 | Tragic 82.1% |
| Immigrants | Central America | 0.0 /100 | #308 | Tragic 82.0% |
| Cree | 0.0 /100 | #309 | Tragic 82.0% |
| Blackfeet | 0.0 /100 | #310 | Tragic 81.9% |
| Colville | 0.0 /100 | #311 | Tragic 81.7% |
| Alaska Natives | 0.0 /100 | #312 | Tragic 81.6% |
| Mexicans | 0.0 /100 | #313 | Tragic 81.6% |
| Cajuns | 0.0 /100 | #314 | Tragic 81.5% |
Demographics Similar to Kenyans by In Labor Force | Age 35-44
In terms of in labor force | age 35-44, the demographic groups most similar to Kenyans are Immigrants from Morocco (85.2%, a difference of 0.010%), Immigrants from Poland (85.2%, a difference of 0.010%), Eastern European (85.2%, a difference of 0.010%), Immigrants from Bulgaria (85.2%, a difference of 0.020%), and Immigrants from Zimbabwe (85.2%, a difference of 0.020%).
| Demographics | Rating | Rank | In Labor Force | Age 35-44 |
| Bermudans | 99.9 /100 | #30 | Exceptional 85.3% |
| Czechs | 99.9 /100 | #31 | Exceptional 85.3% |
| Immigrants | India | 99.9 /100 | #32 | Exceptional 85.3% |
| Ugandans | 99.9 /100 | #33 | Exceptional 85.3% |
| Immigrants | Nepal | 99.9 /100 | #34 | Exceptional 85.3% |
| Estonians | 99.9 /100 | #35 | Exceptional 85.3% |
| Immigrants | Morocco | 99.8 /100 | #36 | Exceptional 85.2% |
| Kenyans | 99.8 /100 | #37 | Exceptional 85.2% |
| Immigrants | Poland | 99.8 /100 | #38 | Exceptional 85.2% |
| Eastern Europeans | 99.8 /100 | #39 | Exceptional 85.2% |
| Immigrants | Bulgaria | 99.8 /100 | #40 | Exceptional 85.2% |
| Immigrants | Zimbabwe | 99.8 /100 | #41 | Exceptional 85.2% |
| Macedonians | 99.8 /100 | #42 | Exceptional 85.2% |
| Poles | 99.8 /100 | #43 | Exceptional 85.2% |
| Lithuanians | 99.8 /100 | #44 | Exceptional 85.2% |