Hispanic or Latino vs Argentinean In Labor Force | Age 35-44
COMPARE
Hispanic or Latino
Argentinean
In Labor Force | Age 35-44
In Labor Force | Age 35-44 Comparison
Hispanics or Latinos
Argentineans
82.1%
IN LABOR FORCE | AGE 35-44
0.0/ 100
METRIC RATING
307th/ 347
METRIC RANK
84.6%
IN LABOR FORCE | AGE 35-44
88.4/ 100
METRIC RATING
133rd/ 347
METRIC RANK
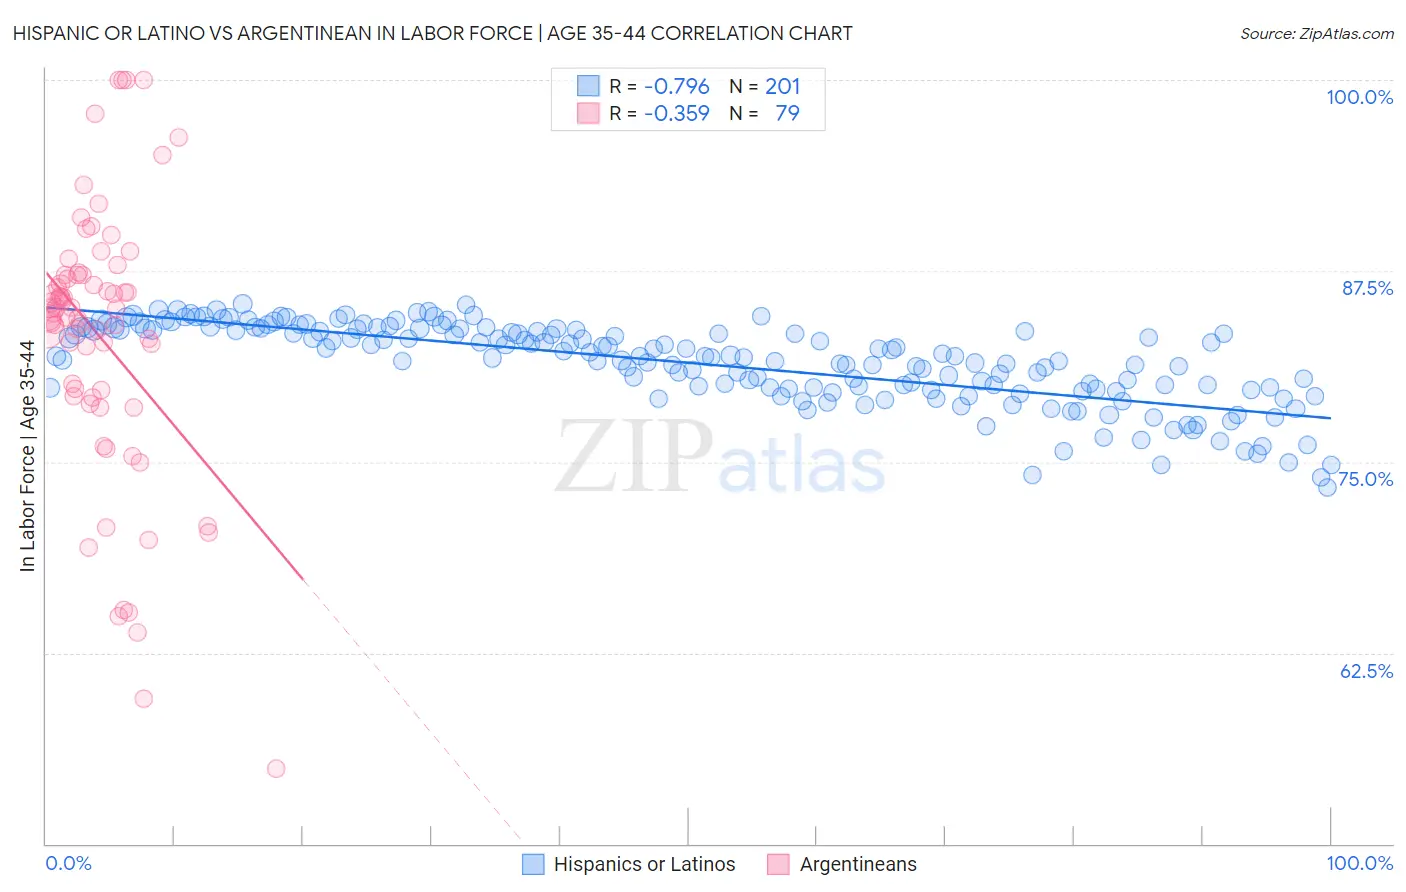
Hispanic or Latino vs Argentinean In Labor Force | Age 35-44 Correlation Chart
The statistical analysis conducted on geographies consisting of 577,755,935 people shows a strong negative correlation between the proportion of Hispanics or Latinos and labor force participation rate among population between the ages 35 and 44 in the United States with a correlation coefficient (R) of -0.796 and weighted average of 82.1%. Similarly, the statistical analysis conducted on geographies consisting of 297,032,479 people shows a mild negative correlation between the proportion of Argentineans and labor force participation rate among population between the ages 35 and 44 in the United States with a correlation coefficient (R) of -0.359 and weighted average of 84.6%, a difference of 3.1%.
In Labor Force | Age 35-44 Correlation Summary
| Measurement | Hispanic or Latino | Argentinean |
| Minimum | 73.3% | 54.9% |
| Maximum | 85.4% | 100.0% |
| Range | 12.1% | 45.1% |
| Mean | 81.5% | 83.2% |
| Median | 81.9% | 85.0% |
| Interquartile 25% (IQ1) | 79.8% | 79.3% |
| Interquartile 75% (IQ3) | 83.7% | 87.2% |
| Interquartile Range (IQR) | 3.9% | 8.0% |
| Standard Deviation (Sample) | 2.7% | 9.0% |
| Standard Deviation (Population) | 2.6% | 8.9% |
Similar Demographics by In Labor Force | Age 35-44
Demographics Similar to Hispanics or Latinos by In Labor Force | Age 35-44
In terms of in labor force | age 35-44, the demographic groups most similar to Hispanics or Latinos are Black/African American (82.2%, a difference of 0.10%), Shoshone (82.2%, a difference of 0.12%), Immigrants from Central America (82.0%, a difference of 0.15%), Cree (82.0%, a difference of 0.15%), and Blackfeet (81.9%, a difference of 0.28%).
| Demographics | Rating | Rank | In Labor Force | Age 35-44 |
| Central American Indians | 0.0 /100 | #300 | Tragic 82.5% |
| Spanish American Indians | 0.0 /100 | #301 | Tragic 82.5% |
| Americans | 0.0 /100 | #302 | Tragic 82.4% |
| Nepalese | 0.0 /100 | #303 | Tragic 82.4% |
| Marshallese | 0.0 /100 | #304 | Tragic 82.4% |
| Shoshone | 0.0 /100 | #305 | Tragic 82.2% |
| Blacks/African Americans | 0.0 /100 | #306 | Tragic 82.2% |
| Hispanics or Latinos | 0.0 /100 | #307 | Tragic 82.1% |
| Immigrants | Central America | 0.0 /100 | #308 | Tragic 82.0% |
| Cree | 0.0 /100 | #309 | Tragic 82.0% |
| Blackfeet | 0.0 /100 | #310 | Tragic 81.9% |
| Colville | 0.0 /100 | #311 | Tragic 81.7% |
| Alaska Natives | 0.0 /100 | #312 | Tragic 81.6% |
| Mexicans | 0.0 /100 | #313 | Tragic 81.6% |
| Cajuns | 0.0 /100 | #314 | Tragic 81.5% |
Demographics Similar to Argentineans by In Labor Force | Age 35-44
In terms of in labor force | age 35-44, the demographic groups most similar to Argentineans are Immigrants from Korea (84.6%, a difference of 0.0%), Immigrants from Malaysia (84.6%, a difference of 0.010%), Palestinian (84.7%, a difference of 0.020%), Bhutanese (84.7%, a difference of 0.020%), and Immigrants from Scotland (84.7%, a difference of 0.020%).
| Demographics | Rating | Rank | In Labor Force | Age 35-44 |
| Asians | 90.6 /100 | #126 | Exceptional 84.7% |
| Immigrants | Spain | 90.6 /100 | #127 | Exceptional 84.7% |
| Immigrants | Ghana | 90.4 /100 | #128 | Exceptional 84.7% |
| Palestinians | 89.7 /100 | #129 | Excellent 84.7% |
| Bhutanese | 89.7 /100 | #130 | Excellent 84.7% |
| Immigrants | Scotland | 89.6 /100 | #131 | Excellent 84.7% |
| Austrians | 89.4 /100 | #132 | Excellent 84.7% |
| Argentineans | 88.4 /100 | #133 | Excellent 84.6% |
| Immigrants | Korea | 88.2 /100 | #134 | Excellent 84.6% |
| Immigrants | Malaysia | 87.5 /100 | #135 | Excellent 84.6% |
| Afghans | 86.3 /100 | #136 | Excellent 84.6% |
| Immigrants | Chile | 84.6 /100 | #137 | Excellent 84.6% |
| Czechoslovakians | 82.6 /100 | #138 | Excellent 84.6% |
| Immigrants | Zaire | 82.5 /100 | #139 | Excellent 84.6% |
| Immigrants | Japan | 81.4 /100 | #140 | Excellent 84.6% |