Dutch West Indian vs Mongolian In Labor Force | Age 35-44
COMPARE
Dutch West Indian
Mongolian
In Labor Force | Age 35-44
In Labor Force | Age 35-44 Comparison
Dutch West Indians
Mongolians
80.4%
IN LABOR FORCE | AGE 35-44
0.0/ 100
METRIC RATING
325th/ 347
METRIC RANK
84.8%
IN LABOR FORCE | AGE 35-44
96.8/ 100
METRIC RATING
94th/ 347
METRIC RANK
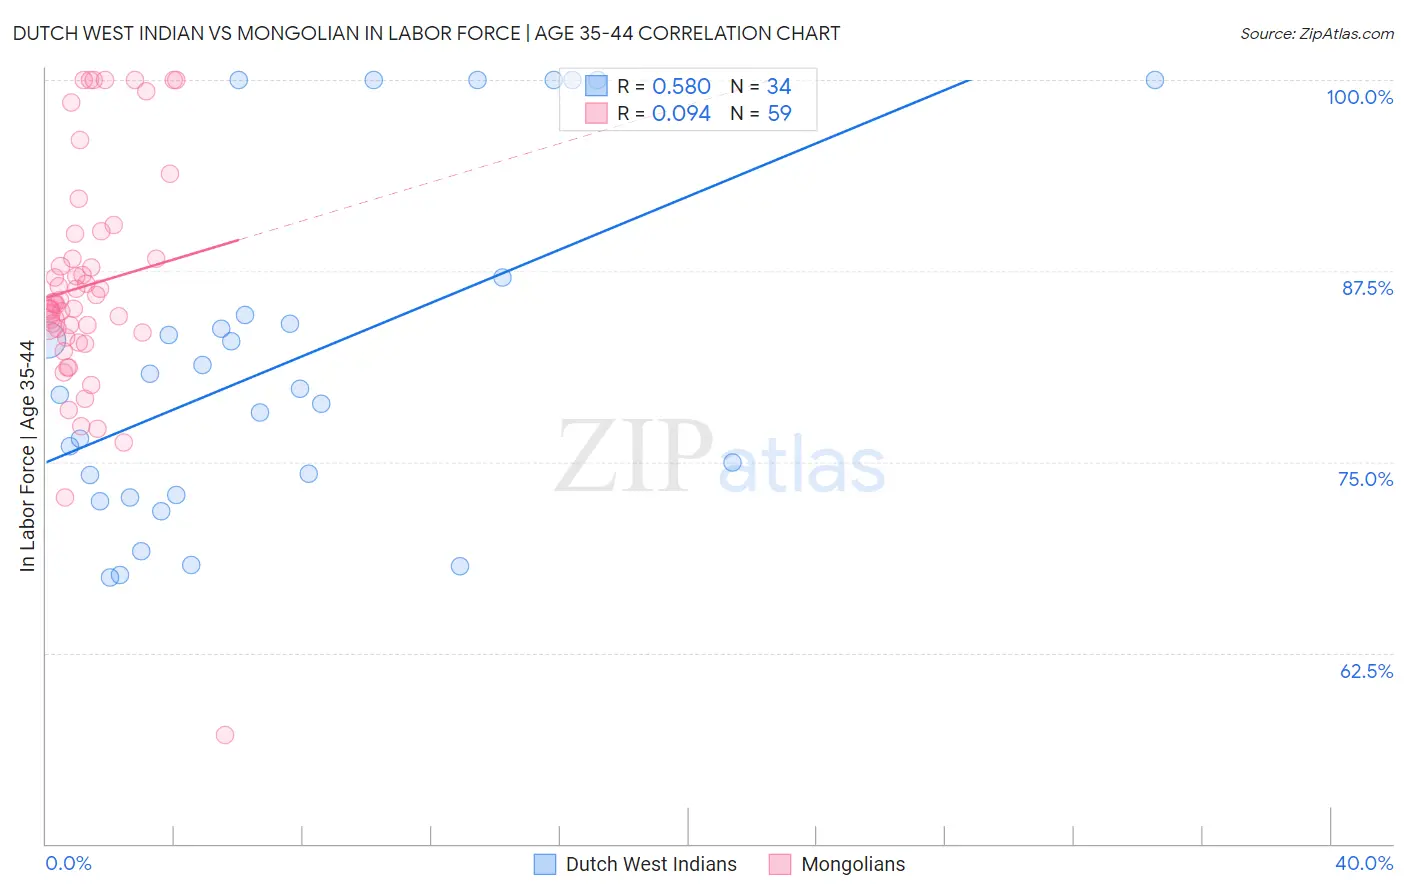
Dutch West Indian vs Mongolian In Labor Force | Age 35-44 Correlation Chart
The statistical analysis conducted on geographies consisting of 85,765,297 people shows a substantial positive correlation between the proportion of Dutch West Indians and labor force participation rate among population between the ages 35 and 44 in the United States with a correlation coefficient (R) of 0.580 and weighted average of 80.4%. Similarly, the statistical analysis conducted on geographies consisting of 140,321,918 people shows a slight positive correlation between the proportion of Mongolians and labor force participation rate among population between the ages 35 and 44 in the United States with a correlation coefficient (R) of 0.094 and weighted average of 84.8%, a difference of 5.5%.
In Labor Force | Age 35-44 Correlation Summary
| Measurement | Dutch West Indian | Mongolian |
| Minimum | 67.4% | 57.1% |
| Maximum | 100.0% | 100.0% |
| Range | 32.6% | 42.9% |
| Mean | 81.6% | 86.6% |
| Median | 79.6% | 85.4% |
| Interquartile 25% (IQ1) | 72.8% | 83.2% |
| Interquartile 75% (IQ3) | 84.6% | 89.9% |
| Interquartile Range (IQR) | 11.8% | 6.8% |
| Standard Deviation (Sample) | 10.9% | 7.8% |
| Standard Deviation (Population) | 10.7% | 7.7% |
Similar Demographics by In Labor Force | Age 35-44
Demographics Similar to Dutch West Indians by In Labor Force | Age 35-44
In terms of in labor force | age 35-44, the demographic groups most similar to Dutch West Indians are Seminole (80.4%, a difference of 0.040%), Choctaw (80.5%, a difference of 0.15%), Yaqui (80.5%, a difference of 0.16%), Sioux (80.2%, a difference of 0.21%), and Paiute (80.6%, a difference of 0.27%).
| Demographics | Rating | Rank | In Labor Force | Age 35-44 |
| Alaskan Athabascans | 0.0 /100 | #318 | Tragic 81.3% |
| Inupiat | 0.0 /100 | #319 | Tragic 80.9% |
| Chickasaw | 0.0 /100 | #320 | Tragic 80.9% |
| Puerto Ricans | 0.0 /100 | #321 | Tragic 80.7% |
| Paiute | 0.0 /100 | #322 | Tragic 80.6% |
| Yaqui | 0.0 /100 | #323 | Tragic 80.5% |
| Choctaw | 0.0 /100 | #324 | Tragic 80.5% |
| Dutch West Indians | 0.0 /100 | #325 | Tragic 80.4% |
| Seminole | 0.0 /100 | #326 | Tragic 80.4% |
| Sioux | 0.0 /100 | #327 | Tragic 80.2% |
| Creek | 0.0 /100 | #328 | Tragic 80.0% |
| Menominee | 0.0 /100 | #329 | Tragic 79.7% |
| Cheyenne | 0.0 /100 | #330 | Tragic 79.5% |
| Houma | 0.0 /100 | #331 | Tragic 79.5% |
| Ute | 0.0 /100 | #332 | Tragic 79.4% |
Demographics Similar to Mongolians by In Labor Force | Age 35-44
In terms of in labor force | age 35-44, the demographic groups most similar to Mongolians are Immigrants from Kuwait (84.8%, a difference of 0.010%), Cuban (84.8%, a difference of 0.010%), Egyptian (84.8%, a difference of 0.010%), Immigrants from Europe (84.9%, a difference of 0.020%), and Ghanaian (84.8%, a difference of 0.020%).
| Demographics | Rating | Rank | In Labor Force | Age 35-44 |
| Belgians | 97.7 /100 | #87 | Exceptional 84.9% |
| Yugoslavians | 97.7 /100 | #88 | Exceptional 84.9% |
| Immigrants | Pakistan | 97.5 /100 | #89 | Exceptional 84.9% |
| Immigrants | France | 97.4 /100 | #90 | Exceptional 84.9% |
| Immigrants | Europe | 97.2 /100 | #91 | Exceptional 84.9% |
| Ghanaians | 97.2 /100 | #92 | Exceptional 84.8% |
| Immigrants | Northern Africa | 97.1 /100 | #93 | Exceptional 84.8% |
| Mongolians | 96.8 /100 | #94 | Exceptional 84.8% |
| Immigrants | Kuwait | 96.7 /100 | #95 | Exceptional 84.8% |
| Cubans | 96.6 /100 | #96 | Exceptional 84.8% |
| Egyptians | 96.6 /100 | #97 | Exceptional 84.8% |
| Indians (Asian) | 96.1 /100 | #98 | Exceptional 84.8% |
| Haitians | 96.0 /100 | #99 | Exceptional 84.8% |
| Immigrants | Czechoslovakia | 95.9 /100 | #100 | Exceptional 84.8% |
| Immigrants | Australia | 95.5 /100 | #101 | Exceptional 84.8% |