Dutch West Indian vs Sri Lankan In Labor Force | Age 35-44
COMPARE
Dutch West Indian
Sri Lankan
In Labor Force | Age 35-44
In Labor Force | Age 35-44 Comparison
Dutch West Indians
Sri Lankans
80.4%
IN LABOR FORCE | AGE 35-44
0.0/ 100
METRIC RATING
325th/ 347
METRIC RANK
84.4%
IN LABOR FORCE | AGE 35-44
47.3/ 100
METRIC RATING
176th/ 347
METRIC RANK
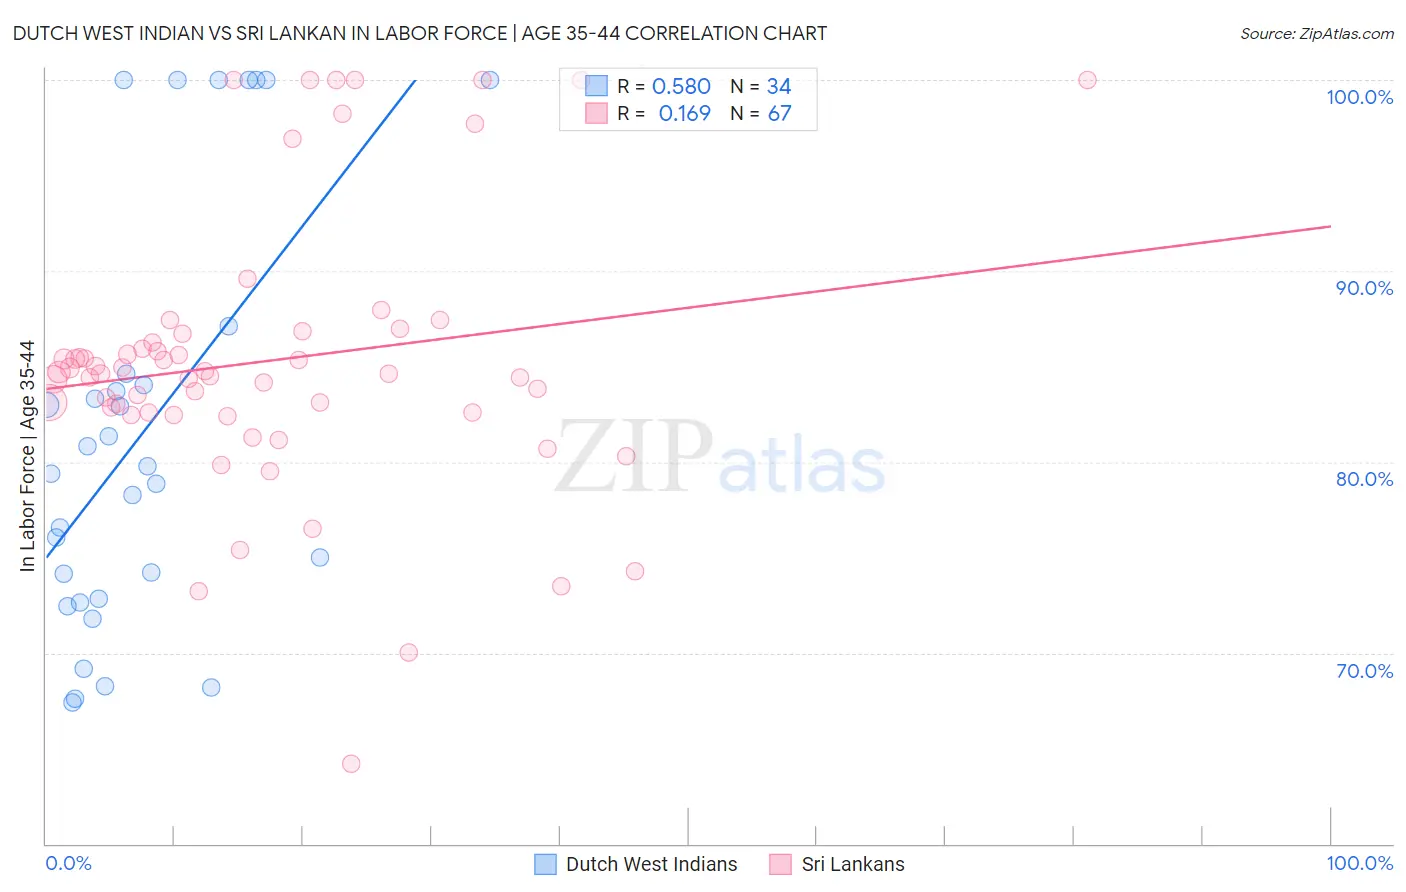
Dutch West Indian vs Sri Lankan In Labor Force | Age 35-44 Correlation Chart
The statistical analysis conducted on geographies consisting of 85,765,297 people shows a substantial positive correlation between the proportion of Dutch West Indians and labor force participation rate among population between the ages 35 and 44 in the United States with a correlation coefficient (R) of 0.580 and weighted average of 80.4%. Similarly, the statistical analysis conducted on geographies consisting of 440,223,389 people shows a poor positive correlation between the proportion of Sri Lankans and labor force participation rate among population between the ages 35 and 44 in the United States with a correlation coefficient (R) of 0.169 and weighted average of 84.4%, a difference of 4.9%.
In Labor Force | Age 35-44 Correlation Summary
| Measurement | Dutch West Indian | Sri Lankan |
| Minimum | 67.4% | 64.2% |
| Maximum | 100.0% | 100.0% |
| Range | 32.6% | 35.8% |
| Mean | 81.6% | 85.3% |
| Median | 79.6% | 84.6% |
| Interquartile 25% (IQ1) | 72.8% | 82.6% |
| Interquartile 75% (IQ3) | 84.6% | 86.7% |
| Interquartile Range (IQR) | 11.8% | 4.1% |
| Standard Deviation (Sample) | 10.9% | 7.3% |
| Standard Deviation (Population) | 10.7% | 7.2% |
Similar Demographics by In Labor Force | Age 35-44
Demographics Similar to Dutch West Indians by In Labor Force | Age 35-44
In terms of in labor force | age 35-44, the demographic groups most similar to Dutch West Indians are Seminole (80.4%, a difference of 0.040%), Choctaw (80.5%, a difference of 0.15%), Yaqui (80.5%, a difference of 0.16%), Sioux (80.2%, a difference of 0.21%), and Paiute (80.6%, a difference of 0.27%).
| Demographics | Rating | Rank | In Labor Force | Age 35-44 |
| Alaskan Athabascans | 0.0 /100 | #318 | Tragic 81.3% |
| Inupiat | 0.0 /100 | #319 | Tragic 80.9% |
| Chickasaw | 0.0 /100 | #320 | Tragic 80.9% |
| Puerto Ricans | 0.0 /100 | #321 | Tragic 80.7% |
| Paiute | 0.0 /100 | #322 | Tragic 80.6% |
| Yaqui | 0.0 /100 | #323 | Tragic 80.5% |
| Choctaw | 0.0 /100 | #324 | Tragic 80.5% |
| Dutch West Indians | 0.0 /100 | #325 | Tragic 80.4% |
| Seminole | 0.0 /100 | #326 | Tragic 80.4% |
| Sioux | 0.0 /100 | #327 | Tragic 80.2% |
| Creek | 0.0 /100 | #328 | Tragic 80.0% |
| Menominee | 0.0 /100 | #329 | Tragic 79.7% |
| Cheyenne | 0.0 /100 | #330 | Tragic 79.5% |
| Houma | 0.0 /100 | #331 | Tragic 79.5% |
| Ute | 0.0 /100 | #332 | Tragic 79.4% |
Demographics Similar to Sri Lankans by In Labor Force | Age 35-44
In terms of in labor force | age 35-44, the demographic groups most similar to Sri Lankans are Pakistani (84.4%, a difference of 0.010%), Immigrants from Trinidad and Tobago (84.4%, a difference of 0.020%), Immigrants from Iran (84.4%, a difference of 0.020%), French Canadian (84.3%, a difference of 0.020%), and Northern European (84.3%, a difference of 0.020%).
| Demographics | Rating | Rank | In Labor Force | Age 35-44 |
| Immigrants | Afghanistan | 52.7 /100 | #169 | Average 84.4% |
| Immigrants | Jordan | 52.5 /100 | #170 | Average 84.4% |
| Jordanians | 51.7 /100 | #171 | Average 84.4% |
| Scandinavians | 51.2 /100 | #172 | Average 84.4% |
| Immigrants | Trinidad and Tobago | 50.7 /100 | #173 | Average 84.4% |
| Immigrants | Iran | 50.0 /100 | #174 | Average 84.4% |
| Pakistanis | 48.2 /100 | #175 | Average 84.4% |
| Sri Lankans | 47.3 /100 | #176 | Average 84.4% |
| French Canadians | 44.3 /100 | #177 | Average 84.3% |
| Northern Europeans | 44.1 /100 | #178 | Average 84.3% |
| Immigrants | South Africa | 42.8 /100 | #179 | Average 84.3% |
| Danes | 38.8 /100 | #180 | Fair 84.3% |
| Immigrants | West Indies | 36.4 /100 | #181 | Fair 84.3% |
| Koreans | 36.3 /100 | #182 | Fair 84.3% |
| Barbadians | 36.2 /100 | #183 | Fair 84.3% |