Dutch West Indian vs Mongolian In Labor Force | Age 16-19
COMPARE
Dutch West Indian
Mongolian
In Labor Force | Age 16-19
In Labor Force | Age 16-19 Comparison
Dutch West Indians
Mongolians
35.6%
IN LABOR FORCE | AGE 16-19
10.7/ 100
METRIC RATING
216th/ 347
METRIC RANK
35.3%
IN LABOR FORCE | AGE 16-19
5.7/ 100
METRIC RATING
227th/ 347
METRIC RANK
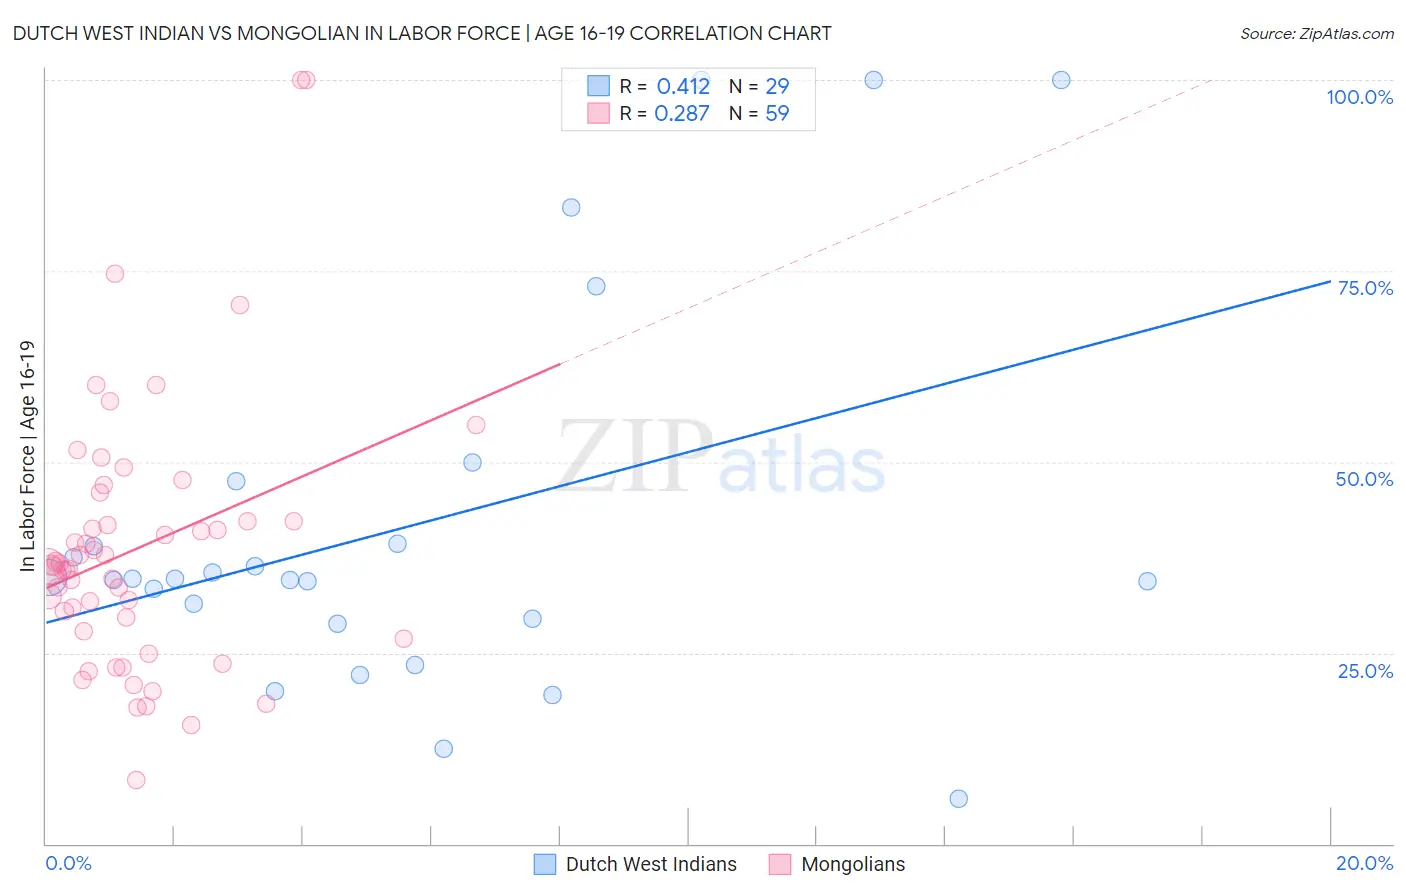
Dutch West Indian vs Mongolian In Labor Force | Age 16-19 Correlation Chart
The statistical analysis conducted on geographies consisting of 85,687,209 people shows a moderate positive correlation between the proportion of Dutch West Indians and labor force participation rate among population between the ages 16 and 19 in the United States with a correlation coefficient (R) of 0.412 and weighted average of 35.6%. Similarly, the statistical analysis conducted on geographies consisting of 140,345,007 people shows a weak positive correlation between the proportion of Mongolians and labor force participation rate among population between the ages 16 and 19 in the United States with a correlation coefficient (R) of 0.287 and weighted average of 35.3%, a difference of 0.89%.
In Labor Force | Age 16-19 Correlation Summary
| Measurement | Dutch West Indian | Mongolian |
| Minimum | 5.9% | 8.3% |
| Maximum | 100.0% | 100.0% |
| Range | 94.1% | 91.7% |
| Mean | 41.7% | 38.6% |
| Median | 34.6% | 36.4% |
| Interquartile 25% (IQ1) | 29.1% | 27.9% |
| Interquartile 75% (IQ3) | 43.4% | 42.3% |
| Interquartile Range (IQR) | 14.3% | 14.4% |
| Standard Deviation (Sample) | 25.2% | 17.5% |
| Standard Deviation (Population) | 24.8% | 17.3% |
Demographics Similar to Dutch West Indians and Mongolians by In Labor Force | Age 16-19
In terms of in labor force | age 16-19, the demographic groups most similar to Dutch West Indians are Immigrants from Costa Rica (35.6%, a difference of 0.0%), Immigrants from South Eastern Asia (35.6%, a difference of 0.020%), Apache (35.6%, a difference of 0.040%), Houma (35.6%, a difference of 0.050%), and Immigrants from Bolivia (35.6%, a difference of 0.050%). Similarly, the demographic groups most similar to Mongolians are Immigrants from Guatemala (35.3%, a difference of 0.010%), Immigrants from Senegal (35.3%, a difference of 0.050%), Immigrants from Belgium (35.3%, a difference of 0.10%), Honduran (35.3%, a difference of 0.18%), and Immigrants from Lebanon (35.2%, a difference of 0.18%).
| Demographics | Rating | Rank | In Labor Force | Age 16-19 |
| Mexicans | 11.9 /100 | #211 | Poor 35.6% |
| Houma | 11.0 /100 | #212 | Poor 35.6% |
| Immigrants | Bolivia | 11.0 /100 | #213 | Poor 35.6% |
| Apache | 11.0 /100 | #214 | Poor 35.6% |
| Immigrants | South Eastern Asia | 10.8 /100 | #215 | Poor 35.6% |
| Dutch West Indians | 10.7 /100 | #216 | Poor 35.6% |
| Immigrants | Costa Rica | 10.7 /100 | #217 | Poor 35.6% |
| Sri Lankans | 9.8 /100 | #218 | Tragic 35.5% |
| Guatemalans | 8.6 /100 | #219 | Tragic 35.5% |
| Immigrants | Bahamas | 8.3 /100 | #220 | Tragic 35.5% |
| Turks | 7.3 /100 | #221 | Tragic 35.4% |
| Immigrants | Ghana | 7.3 /100 | #222 | Tragic 35.4% |
| Ghanaians | 6.5 /100 | #223 | Tragic 35.3% |
| Hondurans | 6.5 /100 | #224 | Tragic 35.3% |
| Immigrants | Belgium | 6.1 /100 | #225 | Tragic 35.3% |
| Immigrants | Guatemala | 5.7 /100 | #226 | Tragic 35.3% |
| Mongolians | 5.7 /100 | #227 | Tragic 35.3% |
| Immigrants | Senegal | 5.5 /100 | #228 | Tragic 35.3% |
| Immigrants | Lebanon | 5.0 /100 | #229 | Tragic 35.2% |
| Immigrants | Honduras | 4.9 /100 | #230 | Tragic 35.2% |
| Immigrants | Syria | 4.5 /100 | #231 | Tragic 35.2% |