Dutch West Indian vs Immigrants from Morocco In Labor Force | Age 35-44
COMPARE
Dutch West Indian
Immigrants from Morocco
In Labor Force | Age 35-44
In Labor Force | Age 35-44 Comparison
Dutch West Indians
Immigrants from Morocco
80.4%
IN LABOR FORCE | AGE 35-44
0.0/ 100
METRIC RATING
325th/ 347
METRIC RANK
85.2%
IN LABOR FORCE | AGE 35-44
99.8/ 100
METRIC RATING
36th/ 347
METRIC RANK
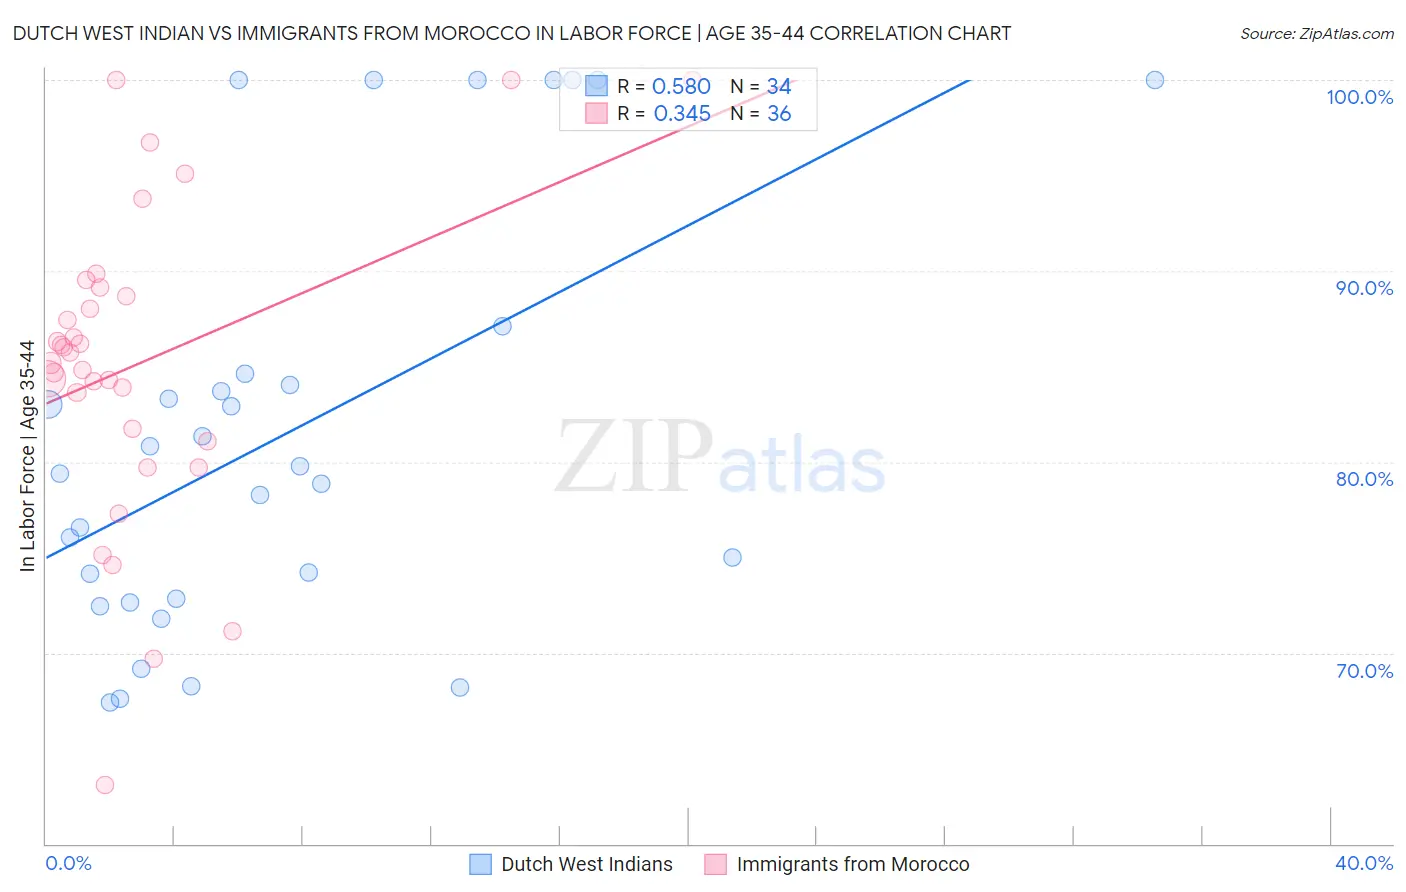
Dutch West Indian vs Immigrants from Morocco In Labor Force | Age 35-44 Correlation Chart
The statistical analysis conducted on geographies consisting of 85,765,297 people shows a substantial positive correlation between the proportion of Dutch West Indians and labor force participation rate among population between the ages 35 and 44 in the United States with a correlation coefficient (R) of 0.580 and weighted average of 80.4%. Similarly, the statistical analysis conducted on geographies consisting of 178,909,040 people shows a mild positive correlation between the proportion of Immigrants from Morocco and labor force participation rate among population between the ages 35 and 44 in the United States with a correlation coefficient (R) of 0.345 and weighted average of 85.2%, a difference of 6.0%.
In Labor Force | Age 35-44 Correlation Summary
| Measurement | Dutch West Indian | Immigrants from Morocco |
| Minimum | 67.4% | 63.1% |
| Maximum | 100.0% | 100.0% |
| Range | 32.6% | 36.9% |
| Mean | 81.6% | 85.1% |
| Median | 79.6% | 85.5% |
| Interquartile 25% (IQ1) | 72.8% | 81.4% |
| Interquartile 75% (IQ3) | 84.6% | 88.9% |
| Interquartile Range (IQR) | 11.8% | 7.5% |
| Standard Deviation (Sample) | 10.9% | 8.2% |
| Standard Deviation (Population) | 10.7% | 8.1% |
Similar Demographics by In Labor Force | Age 35-44
Demographics Similar to Dutch West Indians by In Labor Force | Age 35-44
In terms of in labor force | age 35-44, the demographic groups most similar to Dutch West Indians are Seminole (80.4%, a difference of 0.040%), Choctaw (80.5%, a difference of 0.15%), Yaqui (80.5%, a difference of 0.16%), Sioux (80.2%, a difference of 0.21%), and Paiute (80.6%, a difference of 0.27%).
| Demographics | Rating | Rank | In Labor Force | Age 35-44 |
| Alaskan Athabascans | 0.0 /100 | #318 | Tragic 81.3% |
| Inupiat | 0.0 /100 | #319 | Tragic 80.9% |
| Chickasaw | 0.0 /100 | #320 | Tragic 80.9% |
| Puerto Ricans | 0.0 /100 | #321 | Tragic 80.7% |
| Paiute | 0.0 /100 | #322 | Tragic 80.6% |
| Yaqui | 0.0 /100 | #323 | Tragic 80.5% |
| Choctaw | 0.0 /100 | #324 | Tragic 80.5% |
| Dutch West Indians | 0.0 /100 | #325 | Tragic 80.4% |
| Seminole | 0.0 /100 | #326 | Tragic 80.4% |
| Sioux | 0.0 /100 | #327 | Tragic 80.2% |
| Creek | 0.0 /100 | #328 | Tragic 80.0% |
| Menominee | 0.0 /100 | #329 | Tragic 79.7% |
| Cheyenne | 0.0 /100 | #330 | Tragic 79.5% |
| Houma | 0.0 /100 | #331 | Tragic 79.5% |
| Ute | 0.0 /100 | #332 | Tragic 79.4% |
Demographics Similar to Immigrants from Morocco by In Labor Force | Age 35-44
In terms of in labor force | age 35-44, the demographic groups most similar to Immigrants from Morocco are Kenyan (85.2%, a difference of 0.010%), Immigrants from Poland (85.2%, a difference of 0.020%), Eastern European (85.2%, a difference of 0.020%), Immigrants from Nepal (85.3%, a difference of 0.030%), and Estonian (85.3%, a difference of 0.030%).
| Demographics | Rating | Rank | In Labor Force | Age 35-44 |
| Cambodians | 99.9 /100 | #29 | Exceptional 85.3% |
| Bermudans | 99.9 /100 | #30 | Exceptional 85.3% |
| Czechs | 99.9 /100 | #31 | Exceptional 85.3% |
| Immigrants | India | 99.9 /100 | #32 | Exceptional 85.3% |
| Ugandans | 99.9 /100 | #33 | Exceptional 85.3% |
| Immigrants | Nepal | 99.9 /100 | #34 | Exceptional 85.3% |
| Estonians | 99.9 /100 | #35 | Exceptional 85.3% |
| Immigrants | Morocco | 99.8 /100 | #36 | Exceptional 85.2% |
| Kenyans | 99.8 /100 | #37 | Exceptional 85.2% |
| Immigrants | Poland | 99.8 /100 | #38 | Exceptional 85.2% |
| Eastern Europeans | 99.8 /100 | #39 | Exceptional 85.2% |
| Immigrants | Bulgaria | 99.8 /100 | #40 | Exceptional 85.2% |
| Immigrants | Zimbabwe | 99.8 /100 | #41 | Exceptional 85.2% |
| Macedonians | 99.8 /100 | #42 | Exceptional 85.2% |
| Poles | 99.8 /100 | #43 | Exceptional 85.2% |