Blackfeet vs Mongolian In Labor Force | Age 35-44
COMPARE
Blackfeet
Mongolian
In Labor Force | Age 35-44
In Labor Force | Age 35-44 Comparison
Blackfeet
Mongolians
81.9%
IN LABOR FORCE | AGE 35-44
0.0/ 100
METRIC RATING
310th/ 347
METRIC RANK
84.8%
IN LABOR FORCE | AGE 35-44
96.8/ 100
METRIC RATING
94th/ 347
METRIC RANK
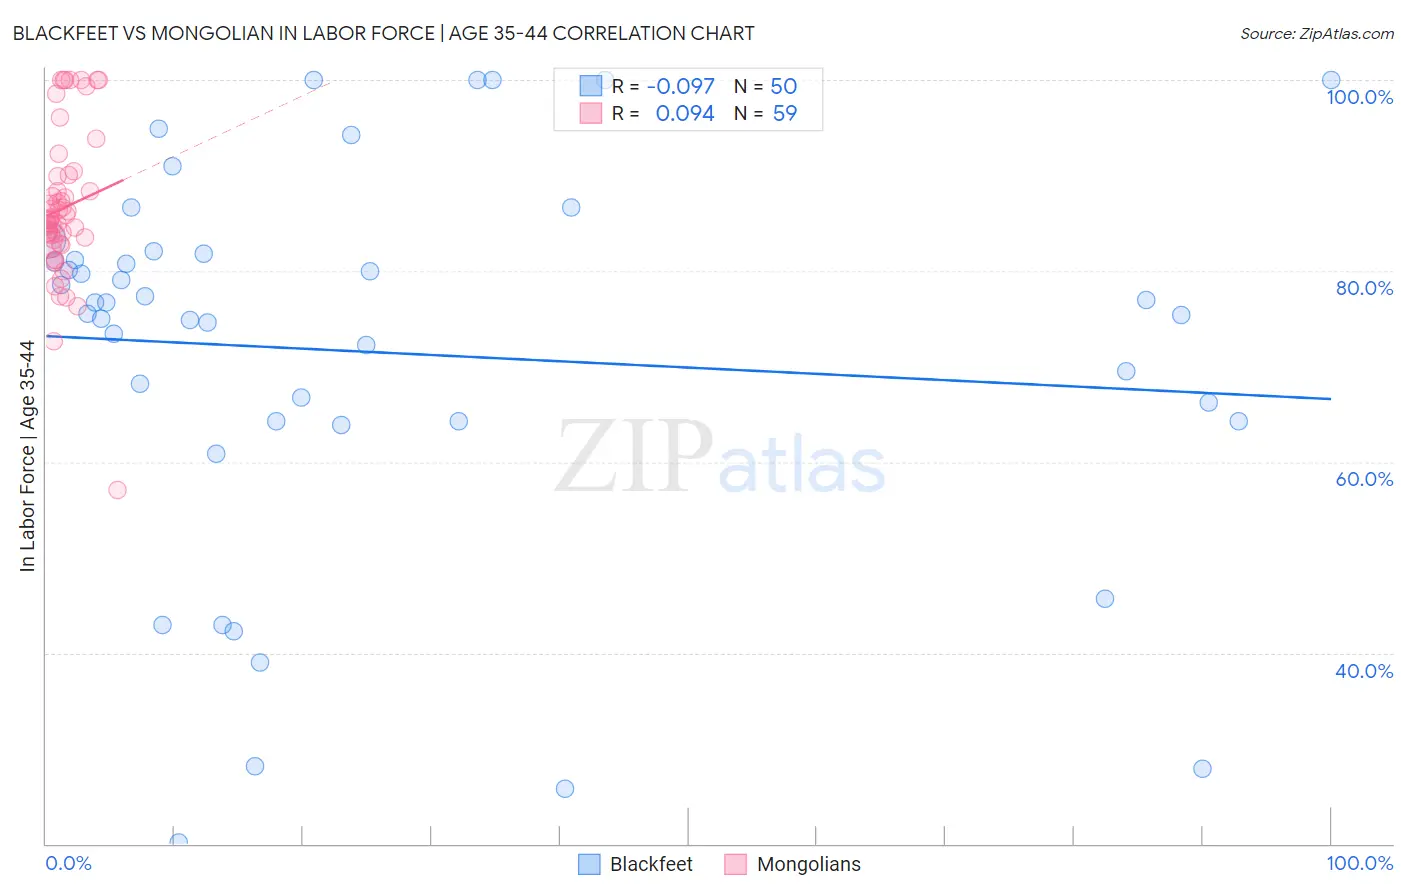
Blackfeet vs Mongolian In Labor Force | Age 35-44 Correlation Chart
The statistical analysis conducted on geographies consisting of 309,495,492 people shows a slight negative correlation between the proportion of Blackfeet and labor force participation rate among population between the ages 35 and 44 in the United States with a correlation coefficient (R) of -0.097 and weighted average of 81.9%. Similarly, the statistical analysis conducted on geographies consisting of 140,321,918 people shows a slight positive correlation between the proportion of Mongolians and labor force participation rate among population between the ages 35 and 44 in the United States with a correlation coefficient (R) of 0.094 and weighted average of 84.8%, a difference of 3.6%.
In Labor Force | Age 35-44 Correlation Summary
| Measurement | Blackfeet | Mongolian |
| Minimum | 20.1% | 57.1% |
| Maximum | 100.0% | 100.0% |
| Range | 79.9% | 42.9% |
| Mean | 71.4% | 86.6% |
| Median | 76.0% | 85.4% |
| Interquartile 25% (IQ1) | 64.2% | 83.2% |
| Interquartile 75% (IQ3) | 81.8% | 89.9% |
| Interquartile Range (IQR) | 17.6% | 6.8% |
| Standard Deviation (Sample) | 20.3% | 7.8% |
| Standard Deviation (Population) | 20.1% | 7.7% |
Similar Demographics by In Labor Force | Age 35-44
Demographics Similar to Blackfeet by In Labor Force | Age 35-44
In terms of in labor force | age 35-44, the demographic groups most similar to Blackfeet are Cree (82.0%, a difference of 0.12%), Immigrants from Central America (82.0%, a difference of 0.13%), Colville (81.7%, a difference of 0.17%), Hispanic or Latino (82.1%, a difference of 0.28%), and Alaska Native (81.6%, a difference of 0.32%).
| Demographics | Rating | Rank | In Labor Force | Age 35-44 |
| Nepalese | 0.0 /100 | #303 | Tragic 82.4% |
| Marshallese | 0.0 /100 | #304 | Tragic 82.4% |
| Shoshone | 0.0 /100 | #305 | Tragic 82.2% |
| Blacks/African Americans | 0.0 /100 | #306 | Tragic 82.2% |
| Hispanics or Latinos | 0.0 /100 | #307 | Tragic 82.1% |
| Immigrants | Central America | 0.0 /100 | #308 | Tragic 82.0% |
| Cree | 0.0 /100 | #309 | Tragic 82.0% |
| Blackfeet | 0.0 /100 | #310 | Tragic 81.9% |
| Colville | 0.0 /100 | #311 | Tragic 81.7% |
| Alaska Natives | 0.0 /100 | #312 | Tragic 81.6% |
| Mexicans | 0.0 /100 | #313 | Tragic 81.6% |
| Cajuns | 0.0 /100 | #314 | Tragic 81.5% |
| Immigrants | Mexico | 0.0 /100 | #315 | Tragic 81.5% |
| Comanche | 0.0 /100 | #316 | Tragic 81.5% |
| Cherokee | 0.0 /100 | #317 | Tragic 81.4% |
Demographics Similar to Mongolians by In Labor Force | Age 35-44
In terms of in labor force | age 35-44, the demographic groups most similar to Mongolians are Immigrants from Kuwait (84.8%, a difference of 0.010%), Cuban (84.8%, a difference of 0.010%), Egyptian (84.8%, a difference of 0.010%), Immigrants from Europe (84.9%, a difference of 0.020%), and Ghanaian (84.8%, a difference of 0.020%).
| Demographics | Rating | Rank | In Labor Force | Age 35-44 |
| Belgians | 97.7 /100 | #87 | Exceptional 84.9% |
| Yugoslavians | 97.7 /100 | #88 | Exceptional 84.9% |
| Immigrants | Pakistan | 97.5 /100 | #89 | Exceptional 84.9% |
| Immigrants | France | 97.4 /100 | #90 | Exceptional 84.9% |
| Immigrants | Europe | 97.2 /100 | #91 | Exceptional 84.9% |
| Ghanaians | 97.2 /100 | #92 | Exceptional 84.8% |
| Immigrants | Northern Africa | 97.1 /100 | #93 | Exceptional 84.8% |
| Mongolians | 96.8 /100 | #94 | Exceptional 84.8% |
| Immigrants | Kuwait | 96.7 /100 | #95 | Exceptional 84.8% |
| Cubans | 96.6 /100 | #96 | Exceptional 84.8% |
| Egyptians | 96.6 /100 | #97 | Exceptional 84.8% |
| Indians (Asian) | 96.1 /100 | #98 | Exceptional 84.8% |
| Haitians | 96.0 /100 | #99 | Exceptional 84.8% |
| Immigrants | Czechoslovakia | 95.9 /100 | #100 | Exceptional 84.8% |
| Immigrants | Australia | 95.5 /100 | #101 | Exceptional 84.8% |