Dutch West Indian vs Immigrants from England In Labor Force | Age 35-44
COMPARE
Dutch West Indian
Immigrants from England
In Labor Force | Age 35-44
In Labor Force | Age 35-44 Comparison
Dutch West Indians
Immigrants from England
80.4%
IN LABOR FORCE | AGE 35-44
0.0/ 100
METRIC RATING
325th/ 347
METRIC RANK
84.2%
IN LABOR FORCE | AGE 35-44
25.0/ 100
METRIC RATING
196th/ 347
METRIC RANK
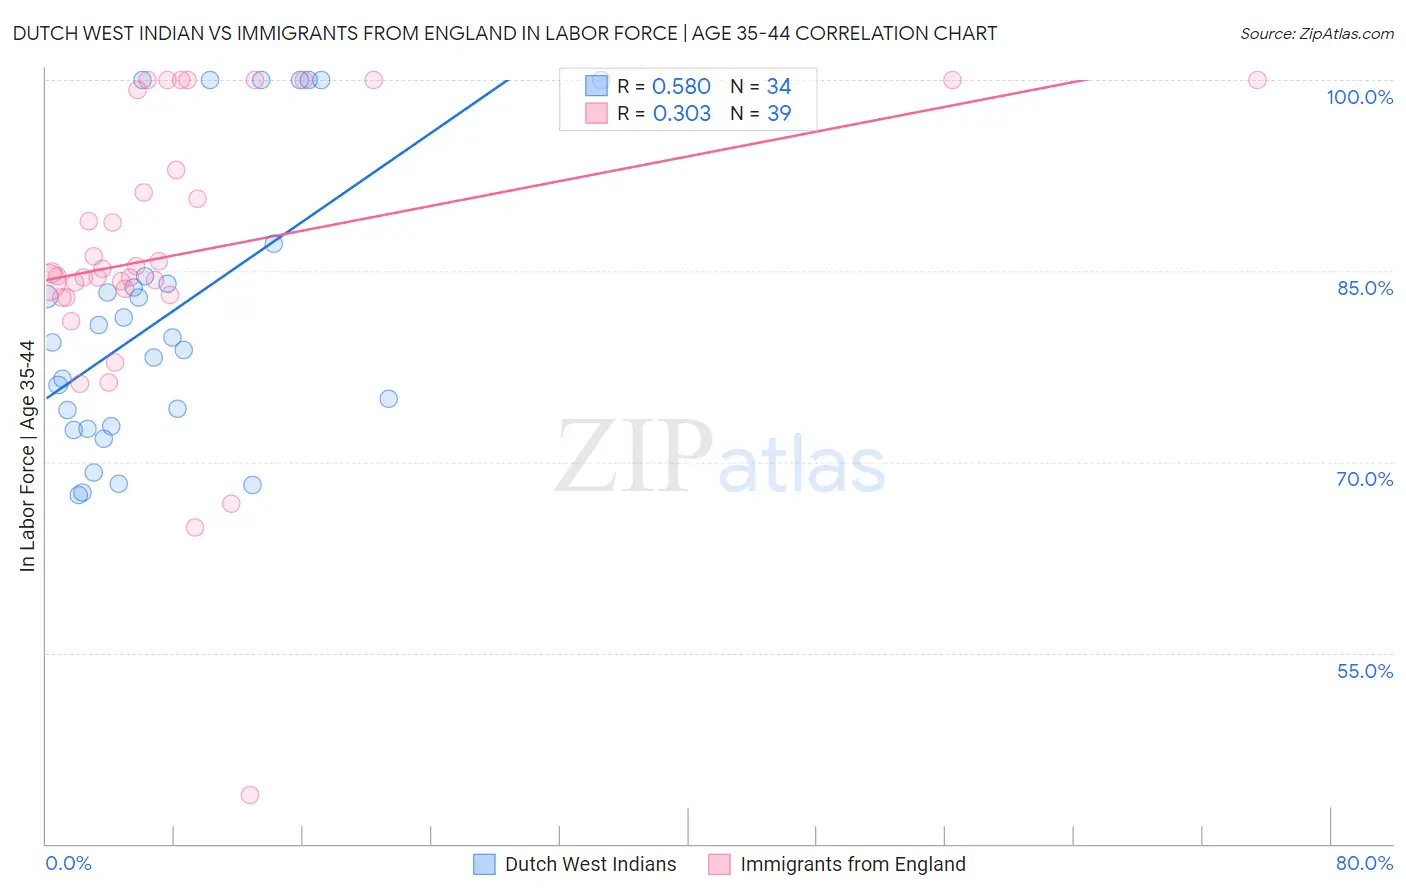
Dutch West Indian vs Immigrants from England In Labor Force | Age 35-44 Correlation Chart
The statistical analysis conducted on geographies consisting of 85,765,297 people shows a substantial positive correlation between the proportion of Dutch West Indians and labor force participation rate among population between the ages 35 and 44 in the United States with a correlation coefficient (R) of 0.580 and weighted average of 80.4%. Similarly, the statistical analysis conducted on geographies consisting of 391,745,799 people shows a mild positive correlation between the proportion of Immigrants from England and labor force participation rate among population between the ages 35 and 44 in the United States with a correlation coefficient (R) of 0.303 and weighted average of 84.2%, a difference of 4.7%.
In Labor Force | Age 35-44 Correlation Summary
| Measurement | Dutch West Indian | Immigrants from England |
| Minimum | 67.4% | 43.8% |
| Maximum | 100.0% | 100.0% |
| Range | 32.6% | 56.2% |
| Mean | 81.6% | 86.5% |
| Median | 79.6% | 84.9% |
| Interquartile 25% (IQ1) | 72.8% | 83.2% |
| Interquartile 75% (IQ3) | 84.6% | 99.3% |
| Interquartile Range (IQR) | 11.8% | 16.1% |
| Standard Deviation (Sample) | 10.9% | 11.5% |
| Standard Deviation (Population) | 10.7% | 11.3% |
Similar Demographics by In Labor Force | Age 35-44
Demographics Similar to Dutch West Indians by In Labor Force | Age 35-44
In terms of in labor force | age 35-44, the demographic groups most similar to Dutch West Indians are Seminole (80.4%, a difference of 0.040%), Choctaw (80.5%, a difference of 0.15%), Yaqui (80.5%, a difference of 0.16%), Sioux (80.2%, a difference of 0.21%), and Paiute (80.6%, a difference of 0.27%).
| Demographics | Rating | Rank | In Labor Force | Age 35-44 |
| Alaskan Athabascans | 0.0 /100 | #318 | Tragic 81.3% |
| Inupiat | 0.0 /100 | #319 | Tragic 80.9% |
| Chickasaw | 0.0 /100 | #320 | Tragic 80.9% |
| Puerto Ricans | 0.0 /100 | #321 | Tragic 80.7% |
| Paiute | 0.0 /100 | #322 | Tragic 80.6% |
| Yaqui | 0.0 /100 | #323 | Tragic 80.5% |
| Choctaw | 0.0 /100 | #324 | Tragic 80.5% |
| Dutch West Indians | 0.0 /100 | #325 | Tragic 80.4% |
| Seminole | 0.0 /100 | #326 | Tragic 80.4% |
| Sioux | 0.0 /100 | #327 | Tragic 80.2% |
| Creek | 0.0 /100 | #328 | Tragic 80.0% |
| Menominee | 0.0 /100 | #329 | Tragic 79.7% |
| Cheyenne | 0.0 /100 | #330 | Tragic 79.5% |
| Houma | 0.0 /100 | #331 | Tragic 79.5% |
| Ute | 0.0 /100 | #332 | Tragic 79.4% |
Demographics Similar to Immigrants from England by In Labor Force | Age 35-44
In terms of in labor force | age 35-44, the demographic groups most similar to Immigrants from England are Immigrants from Western Europe (84.2%, a difference of 0.0%), Hungarian (84.2%, a difference of 0.010%), Immigrants from Indonesia (84.2%, a difference of 0.010%), Immigrants from Caribbean (84.2%, a difference of 0.010%), and Ecuadorian (84.2%, a difference of 0.010%).
| Demographics | Rating | Rank | In Labor Force | Age 35-44 |
| Immigrants | Denmark | 33.7 /100 | #189 | Fair 84.3% |
| Portuguese | 31.9 /100 | #190 | Fair 84.3% |
| Immigrants | Philippines | 27.9 /100 | #191 | Fair 84.2% |
| Immigrants | Vietnam | 27.4 /100 | #192 | Fair 84.2% |
| Hungarians | 26.8 /100 | #193 | Fair 84.2% |
| Immigrants | Indonesia | 25.7 /100 | #194 | Fair 84.2% |
| Immigrants | Caribbean | 25.7 /100 | #195 | Fair 84.2% |
| Immigrants | England | 25.0 /100 | #196 | Fair 84.2% |
| Immigrants | Western Europe | 24.7 /100 | #197 | Fair 84.2% |
| Ecuadorians | 24.0 /100 | #198 | Fair 84.2% |
| Syrians | 23.2 /100 | #199 | Fair 84.2% |
| Moroccans | 23.2 /100 | #200 | Fair 84.2% |
| British | 23.0 /100 | #201 | Fair 84.2% |
| Immigrants | Uzbekistan | 22.8 /100 | #202 | Fair 84.2% |
| Immigrants | South Eastern Asia | 22.4 /100 | #203 | Fair 84.2% |