Dutch West Indian vs Immigrants from Chile In Labor Force | Age 35-44
COMPARE
Dutch West Indian
Immigrants from Chile
In Labor Force | Age 35-44
In Labor Force | Age 35-44 Comparison
Dutch West Indians
Immigrants from Chile
80.4%
IN LABOR FORCE | AGE 35-44
0.0/ 100
METRIC RATING
325th/ 347
METRIC RANK
84.6%
IN LABOR FORCE | AGE 35-44
84.6/ 100
METRIC RATING
137th/ 347
METRIC RANK
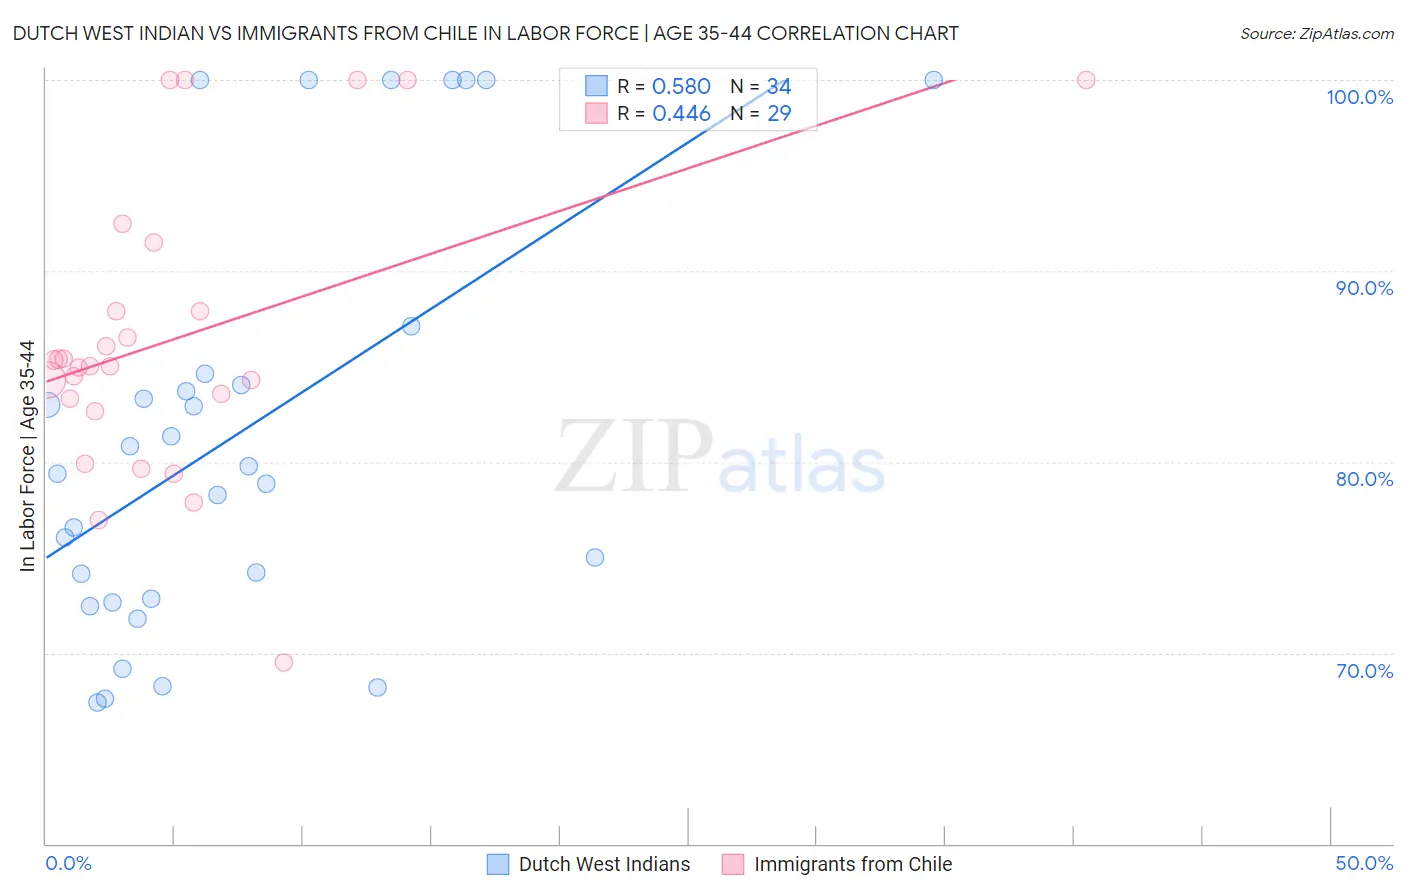
Dutch West Indian vs Immigrants from Chile In Labor Force | Age 35-44 Correlation Chart
The statistical analysis conducted on geographies consisting of 85,765,297 people shows a substantial positive correlation between the proportion of Dutch West Indians and labor force participation rate among population between the ages 35 and 44 in the United States with a correlation coefficient (R) of 0.580 and weighted average of 80.4%. Similarly, the statistical analysis conducted on geographies consisting of 218,627,493 people shows a moderate positive correlation between the proportion of Immigrants from Chile and labor force participation rate among population between the ages 35 and 44 in the United States with a correlation coefficient (R) of 0.446 and weighted average of 84.6%, a difference of 5.2%.
In Labor Force | Age 35-44 Correlation Summary
| Measurement | Dutch West Indian | Immigrants from Chile |
| Minimum | 67.4% | 69.5% |
| Maximum | 100.0% | 100.0% |
| Range | 32.6% | 30.5% |
| Mean | 81.6% | 86.5% |
| Median | 79.6% | 85.0% |
| Interquartile 25% (IQ1) | 72.8% | 83.0% |
| Interquartile 75% (IQ3) | 84.6% | 89.7% |
| Interquartile Range (IQR) | 11.8% | 6.7% |
| Standard Deviation (Sample) | 10.9% | 7.6% |
| Standard Deviation (Population) | 10.7% | 7.5% |
Similar Demographics by In Labor Force | Age 35-44
Demographics Similar to Dutch West Indians by In Labor Force | Age 35-44
In terms of in labor force | age 35-44, the demographic groups most similar to Dutch West Indians are Seminole (80.4%, a difference of 0.040%), Choctaw (80.5%, a difference of 0.15%), Yaqui (80.5%, a difference of 0.16%), Sioux (80.2%, a difference of 0.21%), and Paiute (80.6%, a difference of 0.27%).
| Demographics | Rating | Rank | In Labor Force | Age 35-44 |
| Alaskan Athabascans | 0.0 /100 | #318 | Tragic 81.3% |
| Inupiat | 0.0 /100 | #319 | Tragic 80.9% |
| Chickasaw | 0.0 /100 | #320 | Tragic 80.9% |
| Puerto Ricans | 0.0 /100 | #321 | Tragic 80.7% |
| Paiute | 0.0 /100 | #322 | Tragic 80.6% |
| Yaqui | 0.0 /100 | #323 | Tragic 80.5% |
| Choctaw | 0.0 /100 | #324 | Tragic 80.5% |
| Dutch West Indians | 0.0 /100 | #325 | Tragic 80.4% |
| Seminole | 0.0 /100 | #326 | Tragic 80.4% |
| Sioux | 0.0 /100 | #327 | Tragic 80.2% |
| Creek | 0.0 /100 | #328 | Tragic 80.0% |
| Menominee | 0.0 /100 | #329 | Tragic 79.7% |
| Cheyenne | 0.0 /100 | #330 | Tragic 79.5% |
| Houma | 0.0 /100 | #331 | Tragic 79.5% |
| Ute | 0.0 /100 | #332 | Tragic 79.4% |
Demographics Similar to Immigrants from Chile by In Labor Force | Age 35-44
In terms of in labor force | age 35-44, the demographic groups most similar to Immigrants from Chile are Afghan (84.6%, a difference of 0.020%), Czechoslovakian (84.6%, a difference of 0.020%), Immigrants from Zaire (84.6%, a difference of 0.020%), Immigrants from Malaysia (84.6%, a difference of 0.040%), and Immigrants from Japan (84.6%, a difference of 0.040%).
| Demographics | Rating | Rank | In Labor Force | Age 35-44 |
| Bhutanese | 89.7 /100 | #130 | Excellent 84.7% |
| Immigrants | Scotland | 89.6 /100 | #131 | Excellent 84.7% |
| Austrians | 89.4 /100 | #132 | Excellent 84.7% |
| Argentineans | 88.4 /100 | #133 | Excellent 84.6% |
| Immigrants | Korea | 88.2 /100 | #134 | Excellent 84.6% |
| Immigrants | Malaysia | 87.5 /100 | #135 | Excellent 84.6% |
| Afghans | 86.3 /100 | #136 | Excellent 84.6% |
| Immigrants | Chile | 84.6 /100 | #137 | Excellent 84.6% |
| Czechoslovakians | 82.6 /100 | #138 | Excellent 84.6% |
| Immigrants | Zaire | 82.5 /100 | #139 | Excellent 84.6% |
| Immigrants | Japan | 81.4 /100 | #140 | Excellent 84.6% |
| Immigrants | Belgium | 80.8 /100 | #141 | Excellent 84.6% |
| Immigrants | Uruguay | 80.1 /100 | #142 | Excellent 84.6% |
| Immigrants | Ukraine | 79.7 /100 | #143 | Good 84.6% |
| Immigrants | Jamaica | 79.4 /100 | #144 | Good 84.6% |