Comanche vs Ugandan In Labor Force | Age 25-29
COMPARE
Comanche
Ugandan
In Labor Force | Age 25-29
In Labor Force | Age 25-29 Comparison
Comanche
Ugandans
81.9%
IN LABOR FORCE | AGE 25-29
0.0/ 100
METRIC RATING
318th/ 347
METRIC RANK
85.9%
IN LABOR FORCE | AGE 25-29
100.0/ 100
METRIC RATING
28th/ 347
METRIC RANK
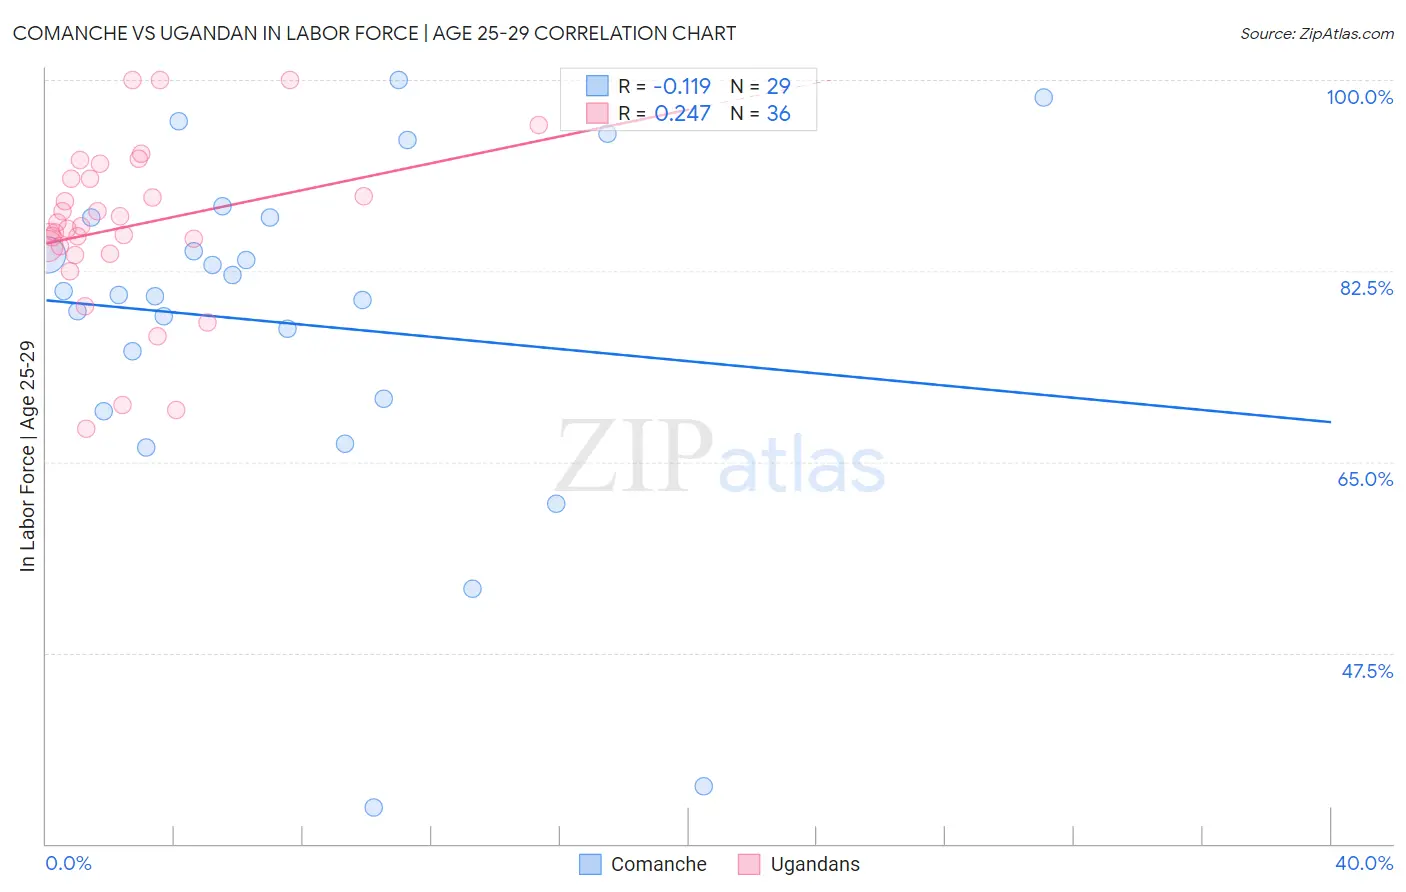
Comanche vs Ugandan In Labor Force | Age 25-29 Correlation Chart
The statistical analysis conducted on geographies consisting of 109,769,144 people shows a poor negative correlation between the proportion of Comanche and labor force participation rate among population between the ages 25 and 29 in the United States with a correlation coefficient (R) of -0.119 and weighted average of 81.9%. Similarly, the statistical analysis conducted on geographies consisting of 94,015,338 people shows a weak positive correlation between the proportion of Ugandans and labor force participation rate among population between the ages 25 and 29 in the United States with a correlation coefficient (R) of 0.247 and weighted average of 85.9%, a difference of 4.9%.
In Labor Force | Age 25-29 Correlation Summary
| Measurement | Comanche | Ugandan |
| Minimum | 33.3% | 68.0% |
| Maximum | 100.0% | 100.0% |
| Range | 66.7% | 32.0% |
| Mean | 77.6% | 86.6% |
| Median | 80.3% | 86.5% |
| Interquartile 25% (IQ1) | 70.2% | 84.5% |
| Interquartile 75% (IQ3) | 87.4% | 90.9% |
| Interquartile Range (IQR) | 17.2% | 6.5% |
| Standard Deviation (Sample) | 16.2% | 7.6% |
| Standard Deviation (Population) | 15.9% | 7.5% |
Similar Demographics by In Labor Force | Age 25-29
Demographics Similar to Comanche by In Labor Force | Age 25-29
In terms of in labor force | age 25-29, the demographic groups most similar to Comanche are Chickasaw (81.9%, a difference of 0.010%), Mexican (81.9%, a difference of 0.090%), Immigrants from Mexico (82.0%, a difference of 0.17%), Seminole (81.7%, a difference of 0.22%), and Colville (81.6%, a difference of 0.27%).
| Demographics | Rating | Rank | In Labor Force | Age 25-29 |
| Alaskan Athabascans | 0.0 /100 | #311 | Tragic 82.3% |
| Hispanics or Latinos | 0.0 /100 | #312 | Tragic 82.2% |
| Yaqui | 0.0 /100 | #313 | Tragic 82.2% |
| Cherokee | 0.0 /100 | #314 | Tragic 82.1% |
| Immigrants | Mexico | 0.0 /100 | #315 | Tragic 82.0% |
| Mexicans | 0.0 /100 | #316 | Tragic 81.9% |
| Chickasaw | 0.0 /100 | #317 | Tragic 81.9% |
| Comanche | 0.0 /100 | #318 | Tragic 81.9% |
| Seminole | 0.0 /100 | #319 | Tragic 81.7% |
| Colville | 0.0 /100 | #320 | Tragic 81.6% |
| Shoshone | 0.0 /100 | #321 | Tragic 81.6% |
| Kiowa | 0.0 /100 | #322 | Tragic 81.6% |
| Alaska Natives | 0.0 /100 | #323 | Tragic 81.6% |
| Houma | 0.0 /100 | #324 | Tragic 81.2% |
| Dutch West Indians | 0.0 /100 | #325 | Tragic 81.1% |
Demographics Similar to Ugandans by In Labor Force | Age 25-29
In terms of in labor force | age 25-29, the demographic groups most similar to Ugandans are Immigrants from Liberia (85.9%, a difference of 0.0%), Paraguayan (85.9%, a difference of 0.010%), Immigrants from North Macedonia (85.9%, a difference of 0.020%), Immigrants from Serbia (85.9%, a difference of 0.040%), and German Russian (85.8%, a difference of 0.050%).
| Demographics | Rating | Rank | In Labor Force | Age 25-29 |
| Maltese | 100.0 /100 | #21 | Exceptional 86.0% |
| Cambodians | 100.0 /100 | #22 | Exceptional 86.0% |
| Immigrants | Uganda | 100.0 /100 | #23 | Exceptional 86.0% |
| Immigrants | Eastern Africa | 100.0 /100 | #24 | Exceptional 86.0% |
| Sudanese | 100.0 /100 | #25 | Exceptional 85.9% |
| Immigrants | North Macedonia | 100.0 /100 | #26 | Exceptional 85.9% |
| Paraguayans | 100.0 /100 | #27 | Exceptional 85.9% |
| Ugandans | 100.0 /100 | #28 | Exceptional 85.9% |
| Immigrants | Liberia | 100.0 /100 | #29 | Exceptional 85.9% |
| Immigrants | Serbia | 100.0 /100 | #30 | Exceptional 85.9% |
| German Russians | 100.0 /100 | #31 | Exceptional 85.8% |
| Slovaks | 100.0 /100 | #32 | Exceptional 85.8% |
| Immigrants | Bulgaria | 100.0 /100 | #33 | Exceptional 85.8% |
| Lithuanians | 99.9 /100 | #34 | Exceptional 85.8% |
| Cypriots | 99.9 /100 | #35 | Exceptional 85.8% |