Comanche vs Ugandan Householder Income Ages 25 - 44 years
COMPARE
Comanche
Ugandan
Householder Income Ages 25 - 44 years
Householder Income Ages 25 - 44 years Comparison
Comanche
Ugandans
$82,152
HOUSEHOLDER INCOME AGES 25 - 44 YEARS
0.1/ 100
METRIC RATING
288th/ 347
METRIC RANK
$96,667
HOUSEHOLDER INCOME AGES 25 - 44 YEARS
76.2/ 100
METRIC RATING
150th/ 347
METRIC RANK
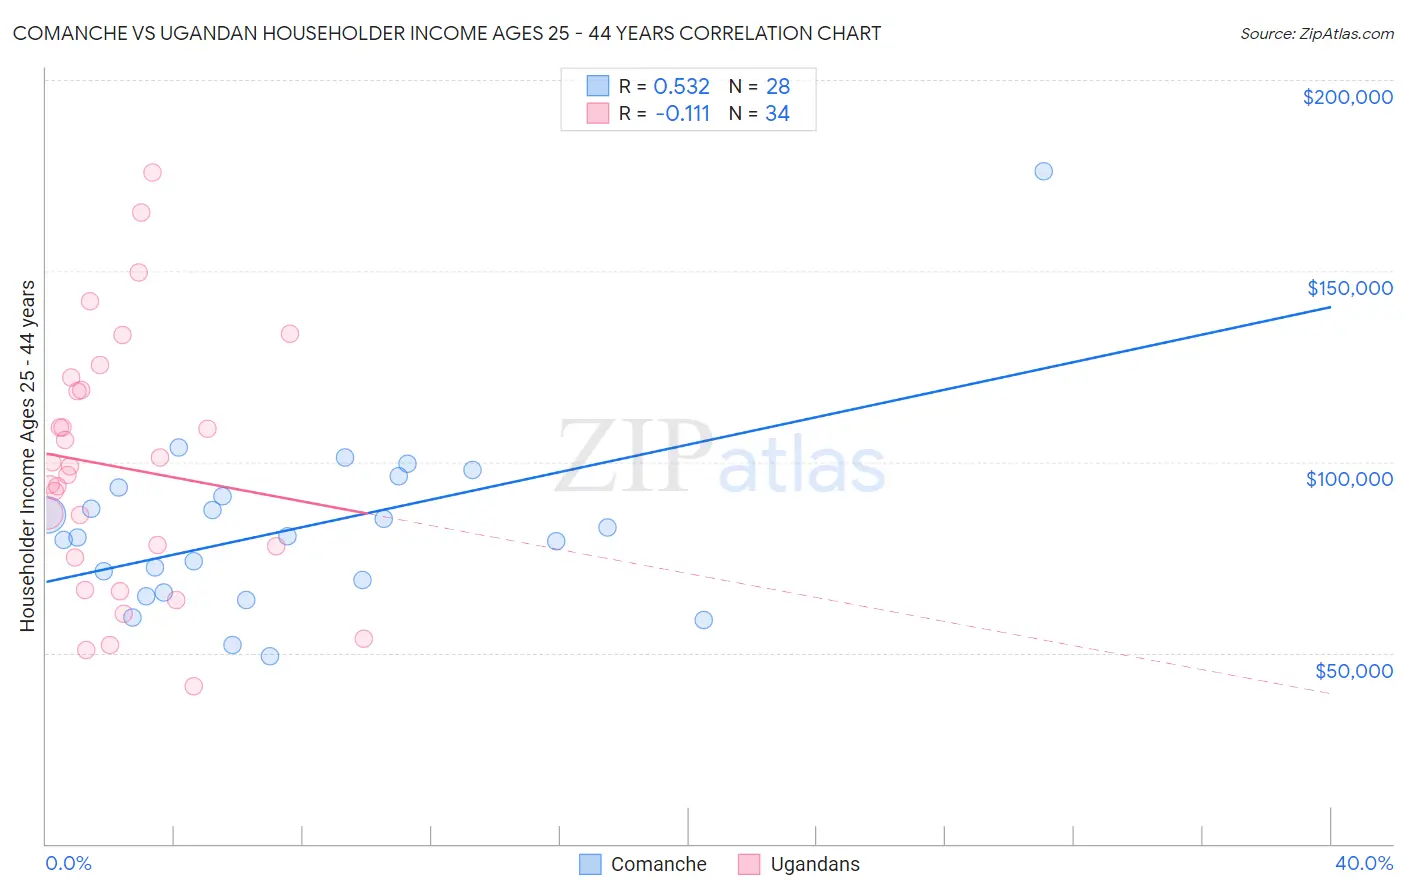
Comanche vs Ugandan Householder Income Ages 25 - 44 years Correlation Chart
The statistical analysis conducted on geographies consisting of 109,664,910 people shows a substantial positive correlation between the proportion of Comanche and household income with householder between the ages 25 and 44 in the United States with a correlation coefficient (R) of 0.532 and weighted average of $82,152. Similarly, the statistical analysis conducted on geographies consisting of 93,976,499 people shows a poor negative correlation between the proportion of Ugandans and household income with householder between the ages 25 and 44 in the United States with a correlation coefficient (R) of -0.111 and weighted average of $96,667, a difference of 17.7%.
Householder Income Ages 25 - 44 years Correlation Summary
| Measurement | Comanche | Ugandan |
| Minimum | $49,171 | $41,159 |
| Maximum | $176,131 | $175,893 |
| Range | $126,960 | $134,734 |
| Mean | $82,424 | $98,580 |
| Median | $80,487 | $97,758 |
| Interquartile 25% (IQ1) | $67,374 | $74,874 |
| Interquartile 75% (IQ3) | $92,050 | $118,938 |
| Interquartile Range (IQR) | $24,676 | $44,063 |
| Standard Deviation (Sample) | $23,672 | $33,089 |
| Standard Deviation (Population) | $23,245 | $32,599 |
Similar Demographics by Householder Income Ages 25 - 44 years
Demographics Similar to Comanche by Householder Income Ages 25 - 44 years
In terms of householder income ages 25 - 44 years, the demographic groups most similar to Comanche are Ute ($82,166, a difference of 0.020%), Immigrants from Latin America ($82,166, a difference of 0.020%), Immigrants from Somalia ($82,188, a difference of 0.040%), Shoshone ($82,062, a difference of 0.11%), and Immigrants from Middle Africa ($82,254, a difference of 0.12%).
| Demographics | Rating | Rank | Householder Income Ages 25 - 44 years |
| Cajuns | 0.1 /100 | #281 | Tragic $82,393 |
| Central American Indians | 0.1 /100 | #282 | Tragic $82,355 |
| Guatemalans | 0.1 /100 | #283 | Tragic $82,331 |
| Immigrants | Middle Africa | 0.1 /100 | #284 | Tragic $82,254 |
| Immigrants | Somalia | 0.1 /100 | #285 | Tragic $82,188 |
| Ute | 0.1 /100 | #286 | Tragic $82,166 |
| Immigrants | Latin America | 0.1 /100 | #287 | Tragic $82,166 |
| Comanche | 0.1 /100 | #288 | Tragic $82,152 |
| Shoshone | 0.1 /100 | #289 | Tragic $82,062 |
| Liberians | 0.1 /100 | #290 | Tragic $82,005 |
| Potawatomi | 0.1 /100 | #291 | Tragic $81,774 |
| Yaqui | 0.1 /100 | #292 | Tragic $81,656 |
| Blackfeet | 0.1 /100 | #293 | Tragic $81,531 |
| Cubans | 0.1 /100 | #294 | Tragic $81,483 |
| Bangladeshis | 0.1 /100 | #295 | Tragic $81,363 |
Demographics Similar to Ugandans by Householder Income Ages 25 - 44 years
In terms of householder income ages 25 - 44 years, the demographic groups most similar to Ugandans are Basque ($96,709, a difference of 0.040%), Irish ($96,730, a difference of 0.070%), Immigrants from Syria ($96,789, a difference of 0.13%), Czech ($96,525, a difference of 0.15%), and Ethiopian ($96,824, a difference of 0.16%).
| Demographics | Rating | Rank | Householder Income Ages 25 - 44 years |
| Immigrants | Jordan | 81.0 /100 | #143 | Excellent $97,185 |
| Immigrants | Chile | 80.8 /100 | #144 | Excellent $97,159 |
| Norwegians | 78.2 /100 | #145 | Good $96,866 |
| Ethiopians | 77.8 /100 | #146 | Good $96,824 |
| Immigrants | Syria | 77.4 /100 | #147 | Good $96,789 |
| Irish | 76.9 /100 | #148 | Good $96,730 |
| Basques | 76.6 /100 | #149 | Good $96,709 |
| Ugandans | 76.2 /100 | #150 | Good $96,667 |
| Czechs | 74.8 /100 | #151 | Good $96,525 |
| South American Indians | 74.5 /100 | #152 | Good $96,497 |
| Slovenes | 73.9 /100 | #153 | Good $96,439 |
| Slavs | 73.2 /100 | #154 | Good $96,377 |
| Moroccans | 70.3 /100 | #155 | Good $96,117 |
| Immigrants | Germany | 67.9 /100 | #156 | Good $95,913 |
| Immigrants | Uganda | 65.2 /100 | #157 | Good $95,698 |