Comanche vs Immigrants from Moldova In Labor Force | Age 25-29
COMPARE
Comanche
Immigrants from Moldova
In Labor Force | Age 25-29
In Labor Force | Age 25-29 Comparison
Comanche
Immigrants from Moldova
81.9%
IN LABOR FORCE | AGE 25-29
0.0/ 100
METRIC RATING
318th/ 347
METRIC RANK
85.1%
IN LABOR FORCE | AGE 25-29
95.8/ 100
METRIC RATING
91st/ 347
METRIC RANK
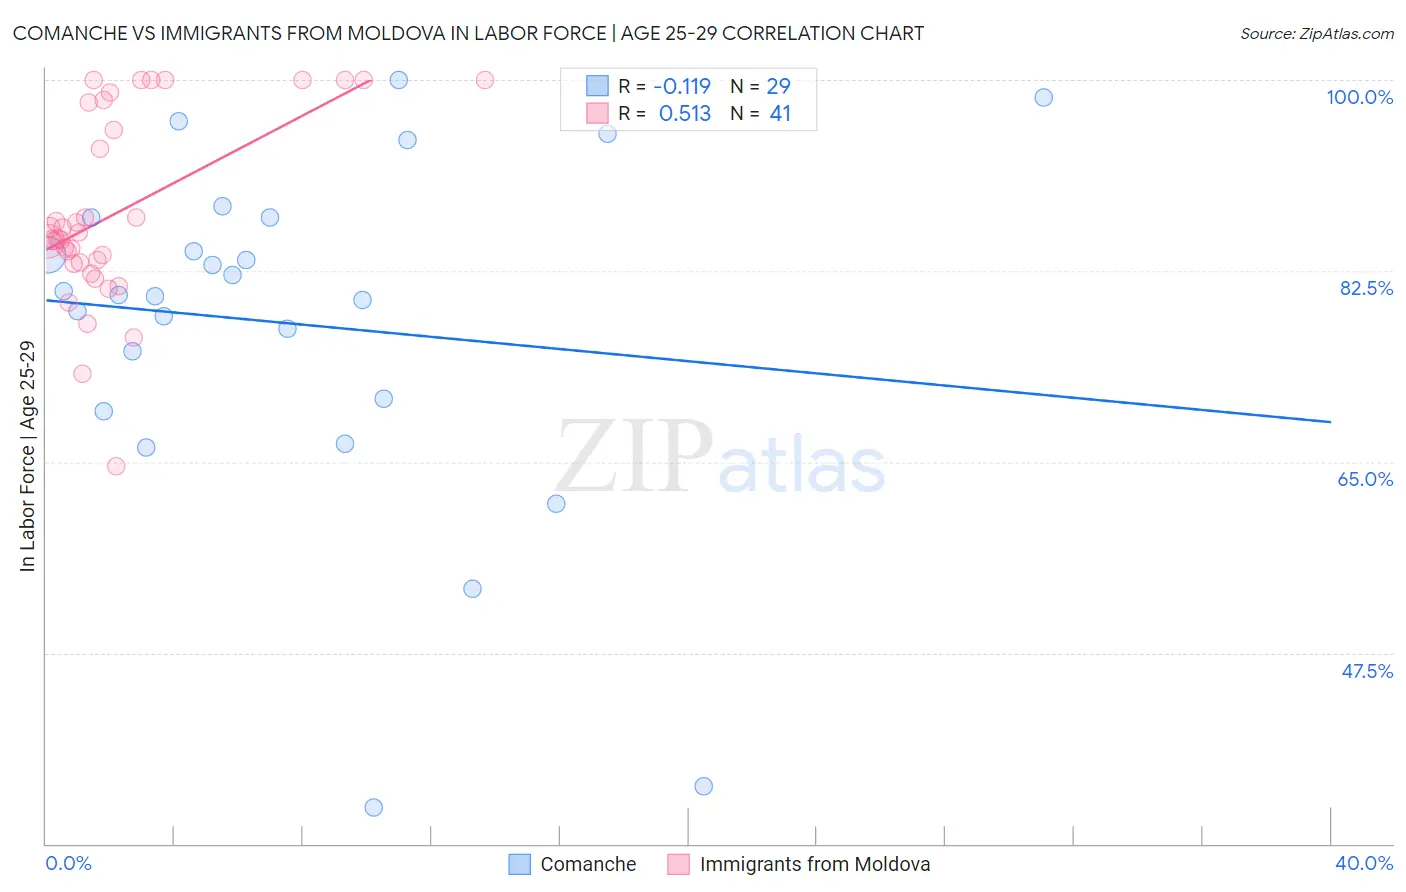
Comanche vs Immigrants from Moldova In Labor Force | Age 25-29 Correlation Chart
The statistical analysis conducted on geographies consisting of 109,769,144 people shows a poor negative correlation between the proportion of Comanche and labor force participation rate among population between the ages 25 and 29 in the United States with a correlation coefficient (R) of -0.119 and weighted average of 81.9%. Similarly, the statistical analysis conducted on geographies consisting of 124,394,056 people shows a substantial positive correlation between the proportion of Immigrants from Moldova and labor force participation rate among population between the ages 25 and 29 in the United States with a correlation coefficient (R) of 0.513 and weighted average of 85.1%, a difference of 4.0%.
In Labor Force | Age 25-29 Correlation Summary
| Measurement | Comanche | Immigrants from Moldova |
| Minimum | 33.3% | 64.6% |
| Maximum | 100.0% | 100.0% |
| Range | 66.7% | 35.4% |
| Mean | 77.6% | 87.9% |
| Median | 80.3% | 85.5% |
| Interquartile 25% (IQ1) | 70.2% | 83.2% |
| Interquartile 75% (IQ3) | 87.4% | 98.1% |
| Interquartile Range (IQR) | 17.2% | 14.9% |
| Standard Deviation (Sample) | 16.2% | 8.6% |
| Standard Deviation (Population) | 15.9% | 8.5% |
Similar Demographics by In Labor Force | Age 25-29
Demographics Similar to Comanche by In Labor Force | Age 25-29
In terms of in labor force | age 25-29, the demographic groups most similar to Comanche are Chickasaw (81.9%, a difference of 0.010%), Mexican (81.9%, a difference of 0.090%), Immigrants from Mexico (82.0%, a difference of 0.17%), Seminole (81.7%, a difference of 0.22%), and Colville (81.6%, a difference of 0.27%).
| Demographics | Rating | Rank | In Labor Force | Age 25-29 |
| Alaskan Athabascans | 0.0 /100 | #311 | Tragic 82.3% |
| Hispanics or Latinos | 0.0 /100 | #312 | Tragic 82.2% |
| Yaqui | 0.0 /100 | #313 | Tragic 82.2% |
| Cherokee | 0.0 /100 | #314 | Tragic 82.1% |
| Immigrants | Mexico | 0.0 /100 | #315 | Tragic 82.0% |
| Mexicans | 0.0 /100 | #316 | Tragic 81.9% |
| Chickasaw | 0.0 /100 | #317 | Tragic 81.9% |
| Comanche | 0.0 /100 | #318 | Tragic 81.9% |
| Seminole | 0.0 /100 | #319 | Tragic 81.7% |
| Colville | 0.0 /100 | #320 | Tragic 81.6% |
| Shoshone | 0.0 /100 | #321 | Tragic 81.6% |
| Kiowa | 0.0 /100 | #322 | Tragic 81.6% |
| Alaska Natives | 0.0 /100 | #323 | Tragic 81.6% |
| Houma | 0.0 /100 | #324 | Tragic 81.2% |
| Dutch West Indians | 0.0 /100 | #325 | Tragic 81.1% |
Demographics Similar to Immigrants from Moldova by In Labor Force | Age 25-29
In terms of in labor force | age 25-29, the demographic groups most similar to Immigrants from Moldova are Burmese (85.1%, a difference of 0.010%), Immigrants from Costa Rica (85.1%, a difference of 0.010%), Austrian (85.1%, a difference of 0.020%), Immigrants from Croatia (85.2%, a difference of 0.030%), and Immigrants from France (85.2%, a difference of 0.030%).
| Demographics | Rating | Rank | In Labor Force | Age 25-29 |
| Immigrants | Eastern Europe | 96.8 /100 | #84 | Exceptional 85.2% |
| Immigrants | Africa | 96.7 /100 | #85 | Exceptional 85.2% |
| Ukrainians | 96.7 /100 | #86 | Exceptional 85.2% |
| French Canadians | 96.5 /100 | #87 | Exceptional 85.2% |
| Immigrants | Croatia | 96.4 /100 | #88 | Exceptional 85.2% |
| Immigrants | France | 96.3 /100 | #89 | Exceptional 85.2% |
| Burmese | 95.9 /100 | #90 | Exceptional 85.1% |
| Immigrants | Moldova | 95.8 /100 | #91 | Exceptional 85.1% |
| Immigrants | Costa Rica | 95.5 /100 | #92 | Exceptional 85.1% |
| Austrians | 95.3 /100 | #93 | Exceptional 85.1% |
| Immigrants | Korea | 94.8 /100 | #94 | Exceptional 85.1% |
| Immigrants | Netherlands | 94.6 /100 | #95 | Exceptional 85.1% |
| Immigrants | Romania | 94.6 /100 | #96 | Exceptional 85.1% |
| Immigrants | Sudan | 94.3 /100 | #97 | Exceptional 85.1% |
| Mongolians | 94.1 /100 | #98 | Exceptional 85.1% |