Sierra Leonean vs Ugandan In Labor Force | Age 25-29
COMPARE
Sierra Leonean
Ugandan
In Labor Force | Age 25-29
In Labor Force | Age 25-29 Comparison
Sierra Leoneans
Ugandans
85.8%
IN LABOR FORCE | AGE 25-29
99.9/ 100
METRIC RATING
38th/ 347
METRIC RANK
85.9%
IN LABOR FORCE | AGE 25-29
100.0/ 100
METRIC RATING
28th/ 347
METRIC RANK
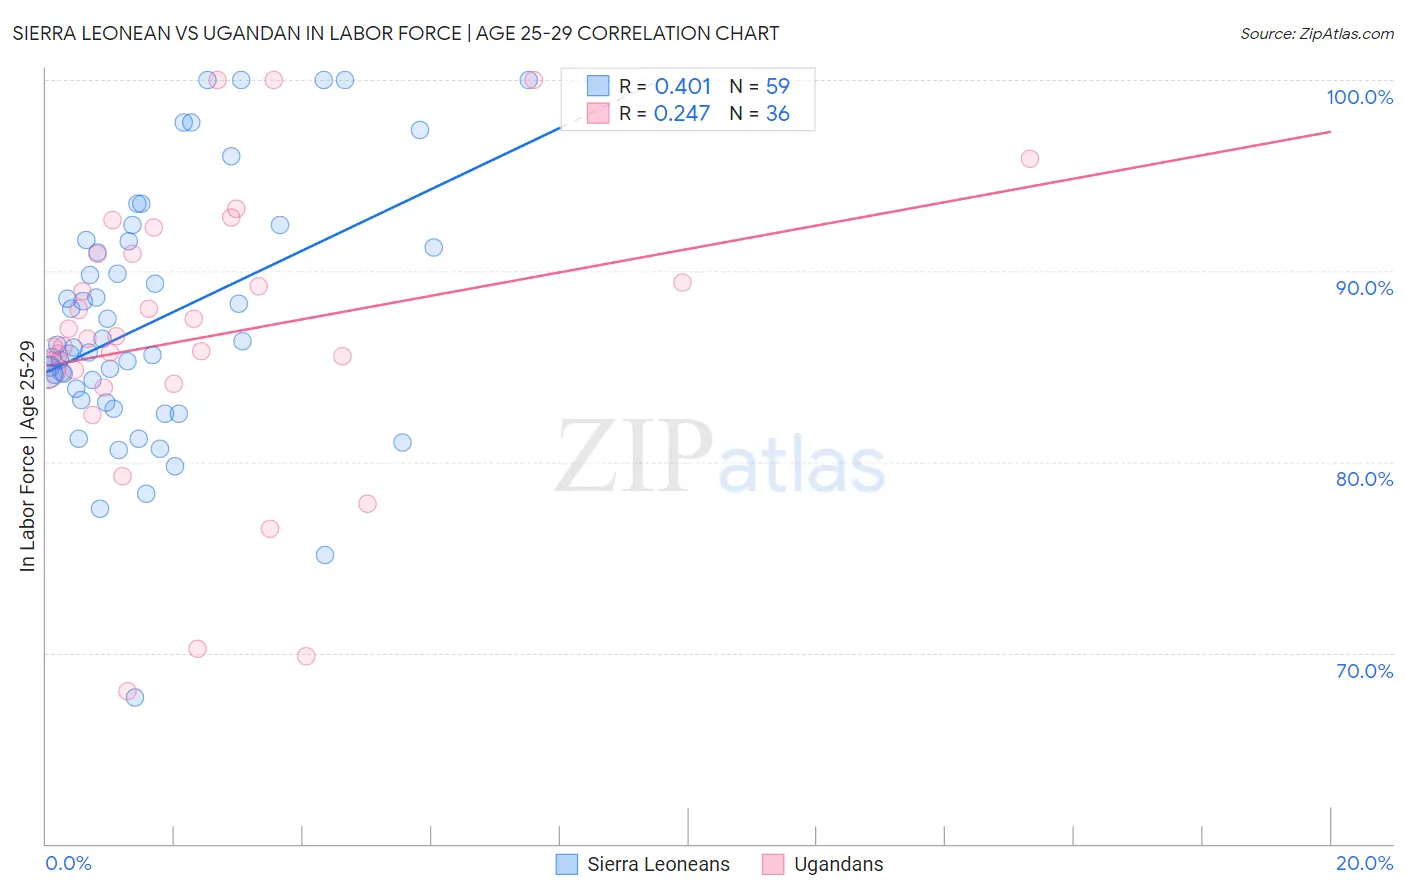
Sierra Leonean vs Ugandan In Labor Force | Age 25-29 Correlation Chart
The statistical analysis conducted on geographies consisting of 83,354,456 people shows a moderate positive correlation between the proportion of Sierra Leoneans and labor force participation rate among population between the ages 25 and 29 in the United States with a correlation coefficient (R) of 0.401 and weighted average of 85.8%. Similarly, the statistical analysis conducted on geographies consisting of 94,015,338 people shows a weak positive correlation between the proportion of Ugandans and labor force participation rate among population between the ages 25 and 29 in the United States with a correlation coefficient (R) of 0.247 and weighted average of 85.9%, a difference of 0.15%.
In Labor Force | Age 25-29 Correlation Summary
| Measurement | Sierra Leonean | Ugandan |
| Minimum | 67.6% | 68.0% |
| Maximum | 100.0% | 100.0% |
| Range | 32.4% | 32.0% |
| Mean | 87.4% | 86.6% |
| Median | 86.0% | 86.5% |
| Interquartile 25% (IQ1) | 83.2% | 84.5% |
| Interquartile 75% (IQ3) | 91.6% | 90.9% |
| Interquartile Range (IQR) | 8.3% | 6.5% |
| Standard Deviation (Sample) | 6.7% | 7.6% |
| Standard Deviation (Population) | 6.6% | 7.5% |
Demographics Similar to Sierra Leoneans and Ugandans by In Labor Force | Age 25-29
In terms of in labor force | age 25-29, the demographic groups most similar to Sierra Leoneans are Croatian (85.8%, a difference of 0.0%), Polish (85.8%, a difference of 0.020%), Immigrants from Albania (85.7%, a difference of 0.020%), Immigrants from Greece (85.7%, a difference of 0.030%), and Cypriot (85.8%, a difference of 0.050%). Similarly, the demographic groups most similar to Ugandans are Immigrants from Liberia (85.9%, a difference of 0.0%), Paraguayan (85.9%, a difference of 0.010%), Immigrants from North Macedonia (85.9%, a difference of 0.020%), Immigrants from Serbia (85.9%, a difference of 0.040%), and German Russian (85.8%, a difference of 0.050%).
| Demographics | Rating | Rank | In Labor Force | Age 25-29 |
| Immigrants | Uganda | 100.0 /100 | #23 | Exceptional 86.0% |
| Immigrants | Eastern Africa | 100.0 /100 | #24 | Exceptional 86.0% |
| Sudanese | 100.0 /100 | #25 | Exceptional 85.9% |
| Immigrants | North Macedonia | 100.0 /100 | #26 | Exceptional 85.9% |
| Paraguayans | 100.0 /100 | #27 | Exceptional 85.9% |
| Ugandans | 100.0 /100 | #28 | Exceptional 85.9% |
| Immigrants | Liberia | 100.0 /100 | #29 | Exceptional 85.9% |
| Immigrants | Serbia | 100.0 /100 | #30 | Exceptional 85.9% |
| German Russians | 100.0 /100 | #31 | Exceptional 85.8% |
| Slovaks | 100.0 /100 | #32 | Exceptional 85.8% |
| Immigrants | Bulgaria | 100.0 /100 | #33 | Exceptional 85.8% |
| Lithuanians | 99.9 /100 | #34 | Exceptional 85.8% |
| Cypriots | 99.9 /100 | #35 | Exceptional 85.8% |
| Immigrants | Nepal | 99.9 /100 | #36 | Exceptional 85.8% |
| Poles | 99.9 /100 | #37 | Exceptional 85.8% |
| Sierra Leoneans | 99.9 /100 | #38 | Exceptional 85.8% |
| Croatians | 99.9 /100 | #39 | Exceptional 85.8% |
| Immigrants | Albania | 99.9 /100 | #40 | Exceptional 85.7% |
| Immigrants | Greece | 99.9 /100 | #41 | Exceptional 85.7% |
| Immigrants | Eritrea | 99.9 /100 | #42 | Exceptional 85.7% |
| Immigrants | India | 99.9 /100 | #43 | Exceptional 85.7% |