Guyanese vs Ugandan In Labor Force | Age 25-29
COMPARE
Guyanese
Ugandan
In Labor Force | Age 25-29
In Labor Force | Age 25-29 Comparison
Guyanese
Ugandans
83.0%
IN LABOR FORCE | AGE 25-29
0.0/ 100
METRIC RATING
287th/ 347
METRIC RANK
85.9%
IN LABOR FORCE | AGE 25-29
100.0/ 100
METRIC RATING
28th/ 347
METRIC RANK
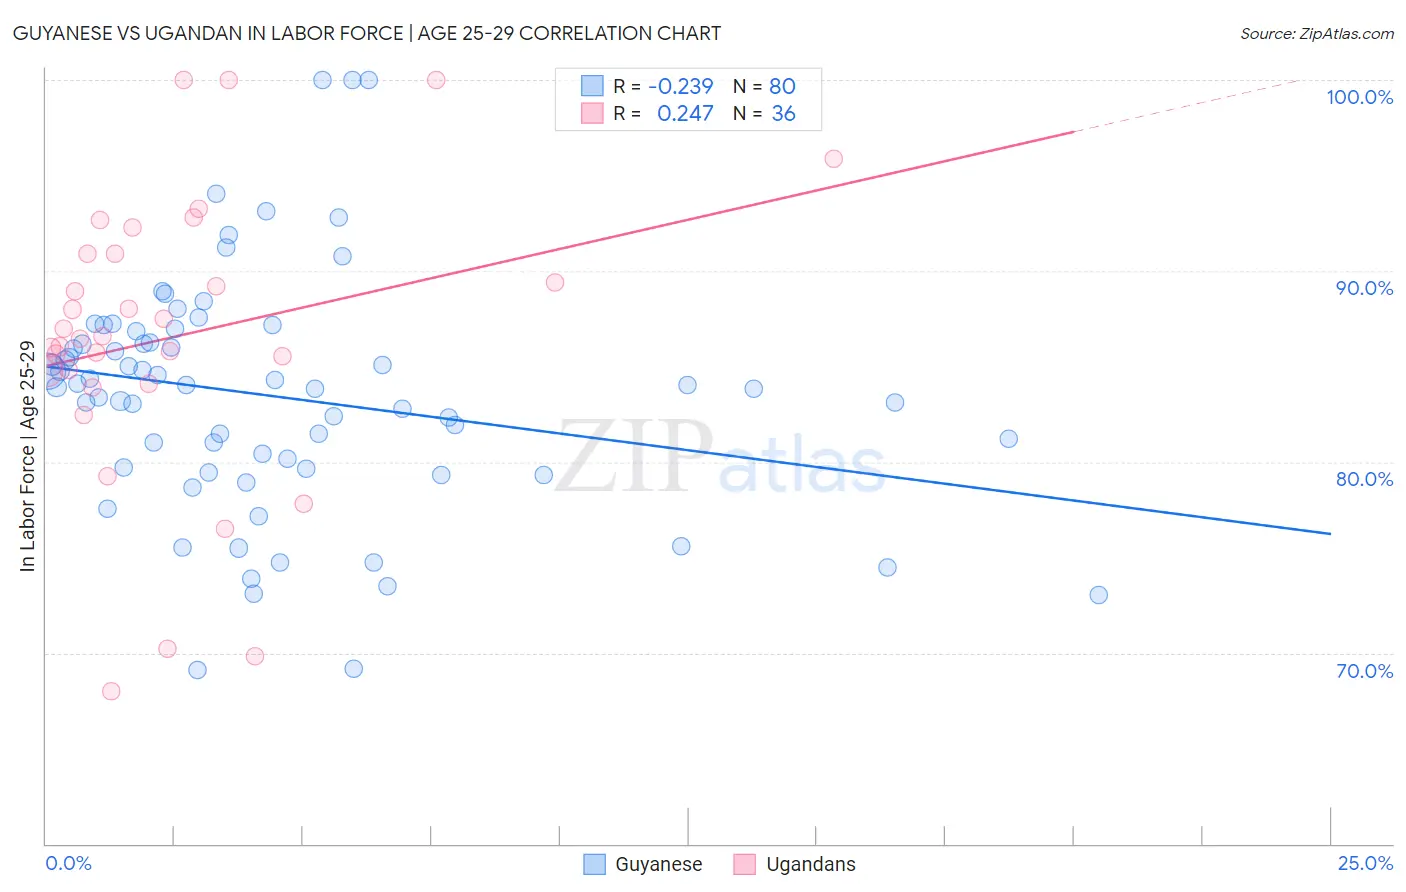
Guyanese vs Ugandan In Labor Force | Age 25-29 Correlation Chart
The statistical analysis conducted on geographies consisting of 176,912,088 people shows a weak negative correlation between the proportion of Guyanese and labor force participation rate among population between the ages 25 and 29 in the United States with a correlation coefficient (R) of -0.239 and weighted average of 83.0%. Similarly, the statistical analysis conducted on geographies consisting of 94,015,338 people shows a weak positive correlation between the proportion of Ugandans and labor force participation rate among population between the ages 25 and 29 in the United States with a correlation coefficient (R) of 0.247 and weighted average of 85.9%, a difference of 3.4%.
In Labor Force | Age 25-29 Correlation Summary
| Measurement | Guyanese | Ugandan |
| Minimum | 69.1% | 68.0% |
| Maximum | 100.0% | 100.0% |
| Range | 30.9% | 32.0% |
| Mean | 83.4% | 86.6% |
| Median | 84.0% | 86.5% |
| Interquartile 25% (IQ1) | 79.7% | 84.5% |
| Interquartile 75% (IQ3) | 86.5% | 90.9% |
| Interquartile Range (IQR) | 6.8% | 6.5% |
| Standard Deviation (Sample) | 6.2% | 7.6% |
| Standard Deviation (Population) | 6.2% | 7.5% |
Similar Demographics by In Labor Force | Age 25-29
Demographics Similar to Guyanese by In Labor Force | Age 25-29
In terms of in labor force | age 25-29, the demographic groups most similar to Guyanese are Mexican American Indian (83.0%, a difference of 0.020%), Belizean (83.1%, a difference of 0.030%), Ottawa (83.0%, a difference of 0.030%), Immigrants from Micronesia (83.0%, a difference of 0.050%), and Nicaraguan (83.1%, a difference of 0.070%).
| Demographics | Rating | Rank | In Labor Force | Age 25-29 |
| Dominicans | 0.0 /100 | #280 | Tragic 83.2% |
| Immigrants | Dominican Republic | 0.0 /100 | #281 | Tragic 83.1% |
| Americans | 0.0 /100 | #282 | Tragic 83.1% |
| Immigrants | Azores | 0.0 /100 | #283 | Tragic 83.1% |
| Nicaraguans | 0.0 /100 | #284 | Tragic 83.1% |
| Belizeans | 0.0 /100 | #285 | Tragic 83.1% |
| Mexican American Indians | 0.0 /100 | #286 | Tragic 83.0% |
| Guyanese | 0.0 /100 | #287 | Tragic 83.0% |
| Ottawa | 0.0 /100 | #288 | Tragic 83.0% |
| Immigrants | Micronesia | 0.0 /100 | #289 | Tragic 83.0% |
| Immigrants | Bangladesh | 0.0 /100 | #290 | Tragic 83.0% |
| Hawaiians | 0.0 /100 | #291 | Tragic 83.0% |
| Immigrants | Guyana | 0.0 /100 | #292 | Tragic 83.0% |
| Immigrants | Latin America | 0.0 /100 | #293 | Tragic 82.9% |
| Nepalese | 0.0 /100 | #294 | Tragic 82.9% |
Demographics Similar to Ugandans by In Labor Force | Age 25-29
In terms of in labor force | age 25-29, the demographic groups most similar to Ugandans are Immigrants from Liberia (85.9%, a difference of 0.0%), Paraguayan (85.9%, a difference of 0.010%), Immigrants from North Macedonia (85.9%, a difference of 0.020%), Immigrants from Serbia (85.9%, a difference of 0.040%), and German Russian (85.8%, a difference of 0.050%).
| Demographics | Rating | Rank | In Labor Force | Age 25-29 |
| Maltese | 100.0 /100 | #21 | Exceptional 86.0% |
| Cambodians | 100.0 /100 | #22 | Exceptional 86.0% |
| Immigrants | Uganda | 100.0 /100 | #23 | Exceptional 86.0% |
| Immigrants | Eastern Africa | 100.0 /100 | #24 | Exceptional 86.0% |
| Sudanese | 100.0 /100 | #25 | Exceptional 85.9% |
| Immigrants | North Macedonia | 100.0 /100 | #26 | Exceptional 85.9% |
| Paraguayans | 100.0 /100 | #27 | Exceptional 85.9% |
| Ugandans | 100.0 /100 | #28 | Exceptional 85.9% |
| Immigrants | Liberia | 100.0 /100 | #29 | Exceptional 85.9% |
| Immigrants | Serbia | 100.0 /100 | #30 | Exceptional 85.9% |
| German Russians | 100.0 /100 | #31 | Exceptional 85.8% |
| Slovaks | 100.0 /100 | #32 | Exceptional 85.8% |
| Immigrants | Bulgaria | 100.0 /100 | #33 | Exceptional 85.8% |
| Lithuanians | 99.9 /100 | #34 | Exceptional 85.8% |
| Cypriots | 99.9 /100 | #35 | Exceptional 85.8% |