Comanche vs Arapaho In Labor Force | Age 25-29
COMPARE
Comanche
Arapaho
In Labor Force | Age 25-29
In Labor Force | Age 25-29 Comparison
Comanche
Arapaho
81.9%
IN LABOR FORCE | AGE 25-29
0.0/ 100
METRIC RATING
318th/ 347
METRIC RANK
76.6%
IN LABOR FORCE | AGE 25-29
0.0/ 100
METRIC RATING
343rd/ 347
METRIC RANK
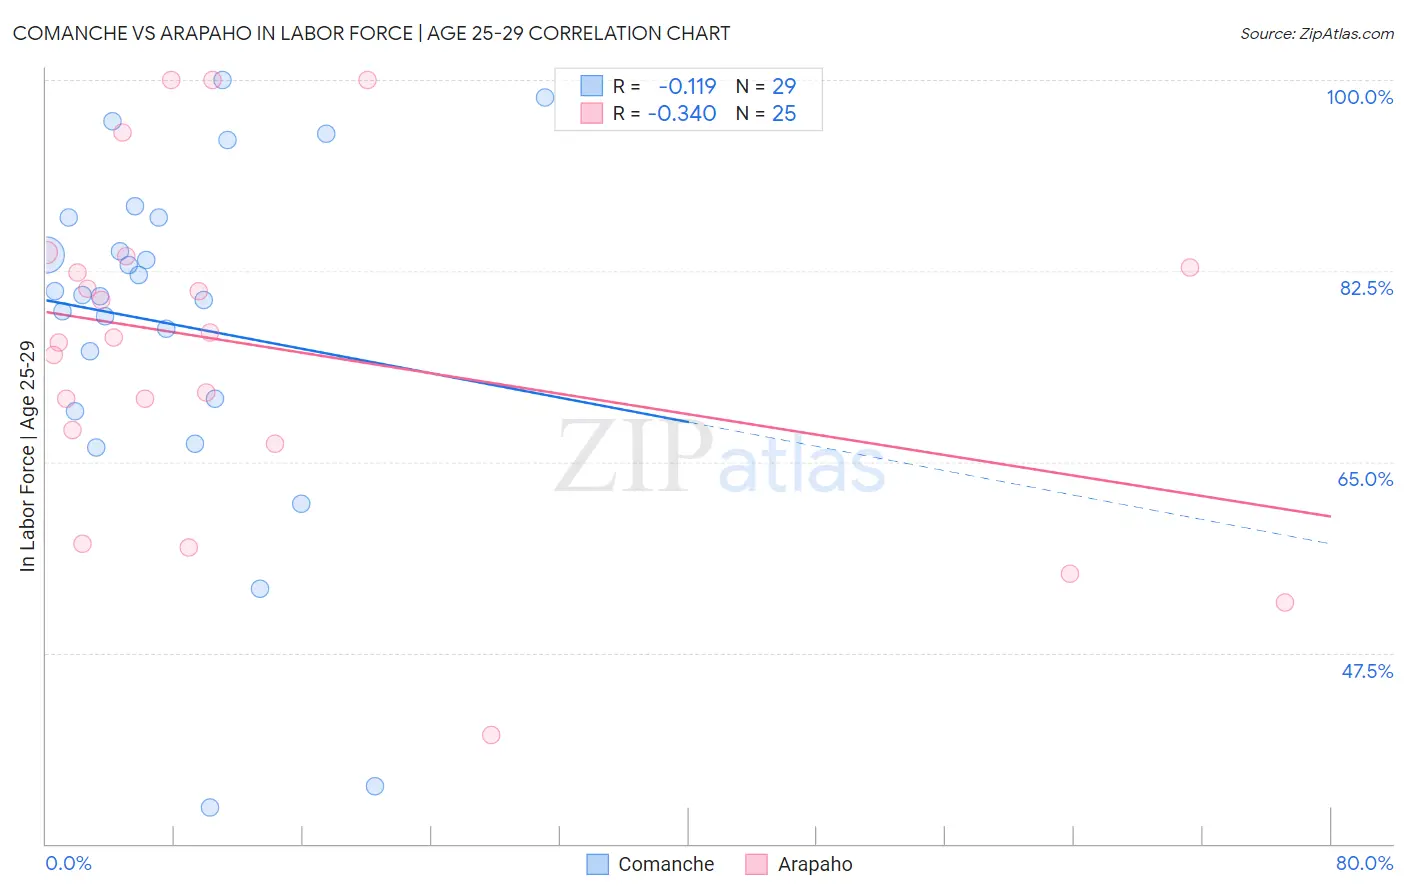
Comanche vs Arapaho In Labor Force | Age 25-29 Correlation Chart
The statistical analysis conducted on geographies consisting of 109,769,144 people shows a poor negative correlation between the proportion of Comanche and labor force participation rate among population between the ages 25 and 29 in the United States with a correlation coefficient (R) of -0.119 and weighted average of 81.9%. Similarly, the statistical analysis conducted on geographies consisting of 29,773,851 people shows a mild negative correlation between the proportion of Arapaho and labor force participation rate among population between the ages 25 and 29 in the United States with a correlation coefficient (R) of -0.340 and weighted average of 76.6%, a difference of 6.9%.
In Labor Force | Age 25-29 Correlation Summary
| Measurement | Comanche | Arapaho |
| Minimum | 33.3% | 40.0% |
| Maximum | 100.0% | 100.0% |
| Range | 66.7% | 60.0% |
| Mean | 77.6% | 75.3% |
| Median | 80.3% | 76.4% |
| Interquartile 25% (IQ1) | 70.2% | 67.3% |
| Interquartile 75% (IQ3) | 87.4% | 83.3% |
| Interquartile Range (IQR) | 17.2% | 16.0% |
| Standard Deviation (Sample) | 16.2% | 15.3% |
| Standard Deviation (Population) | 15.9% | 15.0% |
Similar Demographics by In Labor Force | Age 25-29
Demographics Similar to Comanche by In Labor Force | Age 25-29
In terms of in labor force | age 25-29, the demographic groups most similar to Comanche are Chickasaw (81.9%, a difference of 0.010%), Mexican (81.9%, a difference of 0.090%), Immigrants from Mexico (82.0%, a difference of 0.17%), Seminole (81.7%, a difference of 0.22%), and Colville (81.6%, a difference of 0.27%).
| Demographics | Rating | Rank | In Labor Force | Age 25-29 |
| Alaskan Athabascans | 0.0 /100 | #311 | Tragic 82.3% |
| Hispanics or Latinos | 0.0 /100 | #312 | Tragic 82.2% |
| Yaqui | 0.0 /100 | #313 | Tragic 82.2% |
| Cherokee | 0.0 /100 | #314 | Tragic 82.1% |
| Immigrants | Mexico | 0.0 /100 | #315 | Tragic 82.0% |
| Mexicans | 0.0 /100 | #316 | Tragic 81.9% |
| Chickasaw | 0.0 /100 | #317 | Tragic 81.9% |
| Comanche | 0.0 /100 | #318 | Tragic 81.9% |
| Seminole | 0.0 /100 | #319 | Tragic 81.7% |
| Colville | 0.0 /100 | #320 | Tragic 81.6% |
| Shoshone | 0.0 /100 | #321 | Tragic 81.6% |
| Kiowa | 0.0 /100 | #322 | Tragic 81.6% |
| Alaska Natives | 0.0 /100 | #323 | Tragic 81.6% |
| Houma | 0.0 /100 | #324 | Tragic 81.2% |
| Dutch West Indians | 0.0 /100 | #325 | Tragic 81.1% |
Demographics Similar to Arapaho by In Labor Force | Age 25-29
In terms of in labor force | age 25-29, the demographic groups most similar to Arapaho are Hopi (76.5%, a difference of 0.060%), Pueblo (77.5%, a difference of 1.2%), Tohono O'odham (77.5%, a difference of 1.2%), Paiute (78.1%, a difference of 2.0%), and Immigrants from Yemen (78.2%, a difference of 2.2%).
| Demographics | Rating | Rank | In Labor Force | Age 25-29 |
| Sioux | 0.0 /100 | #333 | Tragic 79.7% |
| Yuman | 0.0 /100 | #334 | Tragic 79.3% |
| Natives/Alaskans | 0.0 /100 | #335 | Tragic 79.3% |
| Apache | 0.0 /100 | #336 | Tragic 79.2% |
| Crow | 0.0 /100 | #337 | Tragic 78.6% |
| Lumbee | 0.0 /100 | #338 | Tragic 78.3% |
| Immigrants | Yemen | 0.0 /100 | #339 | Tragic 78.2% |
| Paiute | 0.0 /100 | #340 | Tragic 78.1% |
| Tohono O'odham | 0.0 /100 | #341 | Tragic 77.5% |
| Pueblo | 0.0 /100 | #342 | Tragic 77.5% |
| Arapaho | 0.0 /100 | #343 | Tragic 76.6% |
| Hopi | 0.0 /100 | #344 | Tragic 76.5% |
| Navajo | 0.0 /100 | #345 | Tragic 74.6% |
| Pima | 0.0 /100 | #346 | Tragic 74.3% |
| Yup'ik | 0.0 /100 | #347 | Tragic 73.1% |