Comanche vs Ugandan Disability Age 65 to 74
COMPARE
Comanche
Ugandan
Disability Age 65 to 74
Disability Age 65 to 74 Comparison
Comanche
Ugandans
28.3%
DISABILITY AGE 65 TO 74
0.0/ 100
METRIC RATING
321st/ 347
METRIC RANK
22.7%
DISABILITY AGE 65 TO 74
85.4/ 100
METRIC RATING
140th/ 347
METRIC RANK
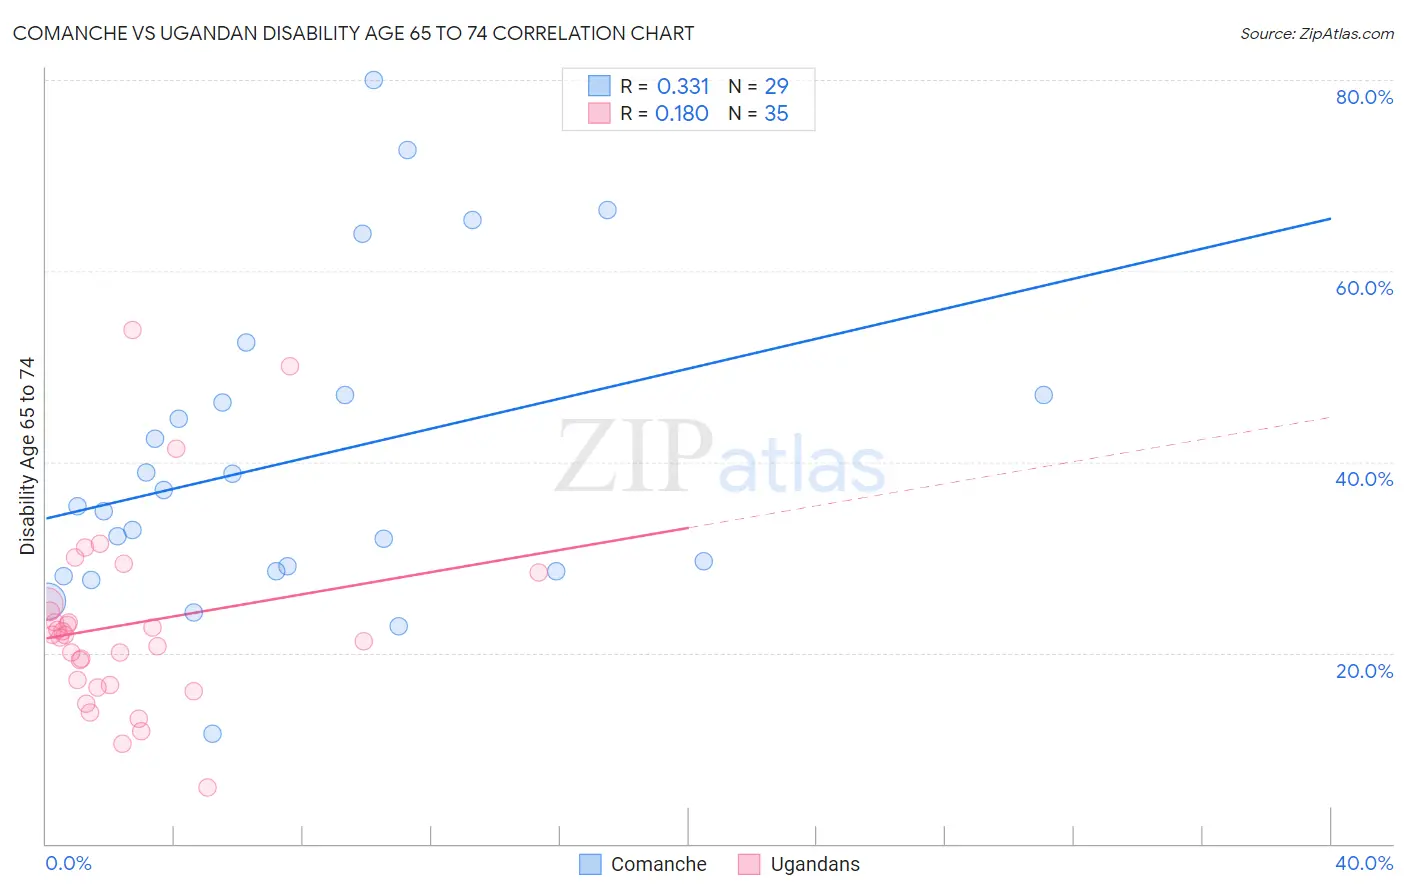
Comanche vs Ugandan Disability Age 65 to 74 Correlation Chart
The statistical analysis conducted on geographies consisting of 109,698,765 people shows a mild positive correlation between the proportion of Comanche and percentage of population with a disability between the ages 65 and 75 in the United States with a correlation coefficient (R) of 0.331 and weighted average of 28.3%. Similarly, the statistical analysis conducted on geographies consisting of 93,935,891 people shows a poor positive correlation between the proportion of Ugandans and percentage of population with a disability between the ages 65 and 75 in the United States with a correlation coefficient (R) of 0.180 and weighted average of 22.7%, a difference of 24.6%.
Disability Age 65 to 74 Correlation Summary
| Measurement | Comanche | Ugandan |
| Minimum | 11.6% | 5.9% |
| Maximum | 80.0% | 53.8% |
| Range | 68.4% | 48.0% |
| Mean | 40.2% | 23.0% |
| Median | 35.3% | 21.9% |
| Interquartile 25% (IQ1) | 28.6% | 16.7% |
| Interquartile 75% (IQ3) | 47.1% | 25.1% |
| Interquartile Range (IQR) | 18.5% | 8.4% |
| Standard Deviation (Sample) | 16.3% | 9.9% |
| Standard Deviation (Population) | 16.1% | 9.8% |
Similar Demographics by Disability Age 65 to 74
Demographics Similar to Comanche by Disability Age 65 to 74
In terms of disability age 65 to 74, the demographic groups most similar to Comanche are Aleut (28.4%, a difference of 0.33%), Cherokee (28.2%, a difference of 0.51%), Arapaho (28.1%, a difference of 0.89%), Nepalese (28.0%, a difference of 1.1%), and Immigrants from Armenia (28.0%, a difference of 1.3%).
| Demographics | Rating | Rank | Disability Age 65 to 74 |
| Chippewa | 0.0 /100 | #314 | Tragic 27.8% |
| Cajuns | 0.0 /100 | #315 | Tragic 27.9% |
| Crow | 0.0 /100 | #316 | Tragic 27.9% |
| Immigrants | Armenia | 0.0 /100 | #317 | Tragic 28.0% |
| Nepalese | 0.0 /100 | #318 | Tragic 28.0% |
| Arapaho | 0.0 /100 | #319 | Tragic 28.1% |
| Cherokee | 0.0 /100 | #320 | Tragic 28.2% |
| Comanche | 0.0 /100 | #321 | Tragic 28.3% |
| Aleuts | 0.0 /100 | #322 | Tragic 28.4% |
| Puerto Ricans | 0.0 /100 | #323 | Tragic 29.1% |
| Seminole | 0.0 /100 | #324 | Tragic 29.4% |
| Dutch West Indians | 0.0 /100 | #325 | Tragic 29.6% |
| Yakama | 0.0 /100 | #326 | Tragic 29.6% |
| Apache | 0.0 /100 | #327 | Tragic 29.7% |
| Hopi | 0.0 /100 | #328 | Tragic 30.0% |
Demographics Similar to Ugandans by Disability Age 65 to 74
In terms of disability age 65 to 74, the demographic groups most similar to Ugandans are Belgian (22.7%, a difference of 0.010%), Immigrants from Ethiopia (22.7%, a difference of 0.020%), Immigrants from Syria (22.7%, a difference of 0.040%), Arab (22.8%, a difference of 0.080%), and Danish (22.8%, a difference of 0.12%).
| Demographics | Rating | Rank | Disability Age 65 to 74 |
| Northern Europeans | 88.9 /100 | #133 | Excellent 22.6% |
| Afghans | 88.6 /100 | #134 | Excellent 22.6% |
| Immigrants | Ukraine | 88.4 /100 | #135 | Excellent 22.6% |
| Ethiopians | 87.9 /100 | #136 | Excellent 22.7% |
| Taiwanese | 87.6 /100 | #137 | Excellent 22.7% |
| Immigrants | Moldova | 87.3 /100 | #138 | Excellent 22.7% |
| Immigrants | Syria | 85.8 /100 | #139 | Excellent 22.7% |
| Ugandans | 85.4 /100 | #140 | Excellent 22.7% |
| Belgians | 85.3 /100 | #141 | Excellent 22.7% |
| Immigrants | Ethiopia | 85.3 /100 | #142 | Excellent 22.7% |
| Arabs | 84.8 /100 | #143 | Excellent 22.8% |
| Danes | 84.4 /100 | #144 | Excellent 22.8% |
| Immigrants | Uganda | 84.0 /100 | #145 | Excellent 22.8% |
| Alsatians | 83.7 /100 | #146 | Excellent 22.8% |
| Immigrants | Uzbekistan | 83.1 /100 | #147 | Excellent 22.8% |