Comanche vs Danish In Labor Force | Age 25-29
COMPARE
Comanche
Danish
In Labor Force | Age 25-29
In Labor Force | Age 25-29 Comparison
Comanche
Danes
81.9%
IN LABOR FORCE | AGE 25-29
0.0/ 100
METRIC RATING
318th/ 347
METRIC RANK
84.8%
IN LABOR FORCE | AGE 25-29
71.9/ 100
METRIC RATING
141st/ 347
METRIC RANK
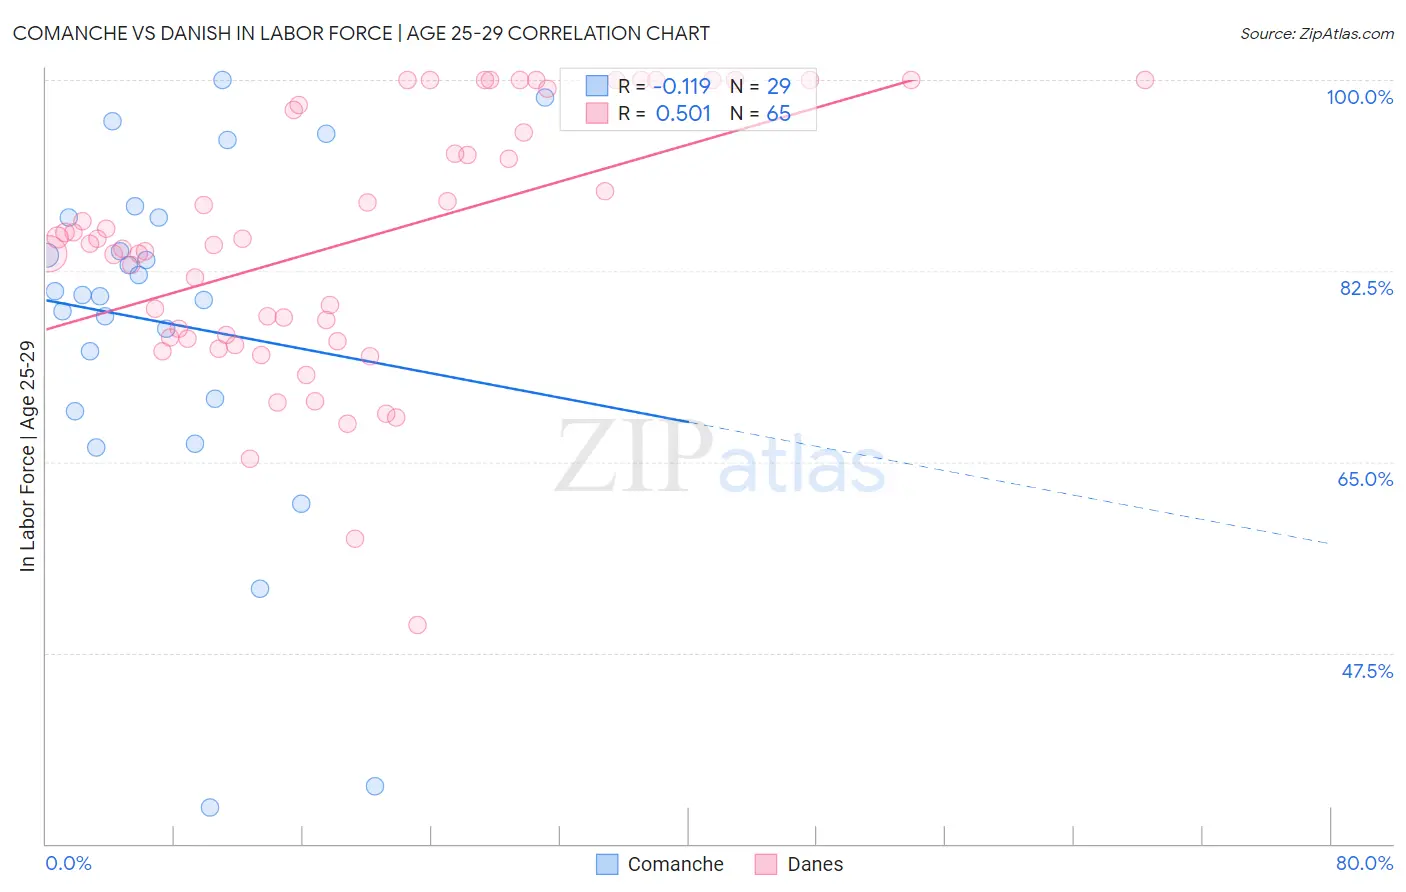
Comanche vs Danish In Labor Force | Age 25-29 Correlation Chart
The statistical analysis conducted on geographies consisting of 109,769,144 people shows a poor negative correlation between the proportion of Comanche and labor force participation rate among population between the ages 25 and 29 in the United States with a correlation coefficient (R) of -0.119 and weighted average of 81.9%. Similarly, the statistical analysis conducted on geographies consisting of 473,784,757 people shows a substantial positive correlation between the proportion of Danes and labor force participation rate among population between the ages 25 and 29 in the United States with a correlation coefficient (R) of 0.501 and weighted average of 84.8%, a difference of 3.6%.
In Labor Force | Age 25-29 Correlation Summary
| Measurement | Comanche | Danish |
| Minimum | 33.3% | 50.0% |
| Maximum | 100.0% | 100.0% |
| Range | 66.7% | 50.0% |
| Mean | 77.6% | 85.1% |
| Median | 80.3% | 85.0% |
| Interquartile 25% (IQ1) | 70.2% | 76.4% |
| Interquartile 75% (IQ3) | 87.4% | 97.5% |
| Interquartile Range (IQR) | 17.2% | 21.1% |
| Standard Deviation (Sample) | 16.2% | 11.7% |
| Standard Deviation (Population) | 15.9% | 11.6% |
Similar Demographics by In Labor Force | Age 25-29
Demographics Similar to Comanche by In Labor Force | Age 25-29
In terms of in labor force | age 25-29, the demographic groups most similar to Comanche are Chickasaw (81.9%, a difference of 0.010%), Mexican (81.9%, a difference of 0.090%), Immigrants from Mexico (82.0%, a difference of 0.17%), Seminole (81.7%, a difference of 0.22%), and Colville (81.6%, a difference of 0.27%).
| Demographics | Rating | Rank | In Labor Force | Age 25-29 |
| Alaskan Athabascans | 0.0 /100 | #311 | Tragic 82.3% |
| Hispanics or Latinos | 0.0 /100 | #312 | Tragic 82.2% |
| Yaqui | 0.0 /100 | #313 | Tragic 82.2% |
| Cherokee | 0.0 /100 | #314 | Tragic 82.1% |
| Immigrants | Mexico | 0.0 /100 | #315 | Tragic 82.0% |
| Mexicans | 0.0 /100 | #316 | Tragic 81.9% |
| Chickasaw | 0.0 /100 | #317 | Tragic 81.9% |
| Comanche | 0.0 /100 | #318 | Tragic 81.9% |
| Seminole | 0.0 /100 | #319 | Tragic 81.7% |
| Colville | 0.0 /100 | #320 | Tragic 81.6% |
| Shoshone | 0.0 /100 | #321 | Tragic 81.6% |
| Kiowa | 0.0 /100 | #322 | Tragic 81.6% |
| Alaska Natives | 0.0 /100 | #323 | Tragic 81.6% |
| Houma | 0.0 /100 | #324 | Tragic 81.2% |
| Dutch West Indians | 0.0 /100 | #325 | Tragic 81.1% |
Demographics Similar to Danes by In Labor Force | Age 25-29
In terms of in labor force | age 25-29, the demographic groups most similar to Danes are Immigrants from North America (84.8%, a difference of 0.0%), Armenian (84.8%, a difference of 0.010%), Immigrants from Eastern Asia (84.8%, a difference of 0.010%), Immigrants from Canada (84.8%, a difference of 0.020%), and Pakistani (84.8%, a difference of 0.020%).
| Demographics | Rating | Rank | In Labor Force | Age 25-29 |
| Syrians | 76.5 /100 | #134 | Good 84.8% |
| Immigrants | Hungary | 76.4 /100 | #135 | Good 84.8% |
| Bhutanese | 76.0 /100 | #136 | Good 84.8% |
| Immigrants | Canada | 73.5 /100 | #137 | Good 84.8% |
| Armenians | 72.7 /100 | #138 | Good 84.8% |
| Immigrants | Eastern Asia | 72.6 /100 | #139 | Good 84.8% |
| Immigrants | North America | 72.1 /100 | #140 | Good 84.8% |
| Danes | 71.9 /100 | #141 | Good 84.8% |
| Pakistanis | 70.0 /100 | #142 | Good 84.8% |
| Sri Lankans | 69.2 /100 | #143 | Good 84.8% |
| Immigrants | Laos | 69.0 /100 | #144 | Good 84.8% |
| Immigrants | Senegal | 68.3 /100 | #145 | Good 84.8% |
| Icelanders | 68.2 /100 | #146 | Good 84.8% |
| Immigrants | Asia | 68.2 /100 | #147 | Good 84.8% |
| Immigrants | England | 65.2 /100 | #148 | Good 84.7% |