Comanche vs Immigrants from Southern Europe In Labor Force | Age 25-29
COMPARE
Comanche
Immigrants from Southern Europe
In Labor Force | Age 25-29
In Labor Force | Age 25-29 Comparison
Comanche
Immigrants from Southern Europe
81.9%
IN LABOR FORCE | AGE 25-29
0.0/ 100
METRIC RATING
318th/ 347
METRIC RANK
85.0%
IN LABOR FORCE | AGE 25-29
92.3/ 100
METRIC RATING
107th/ 347
METRIC RANK
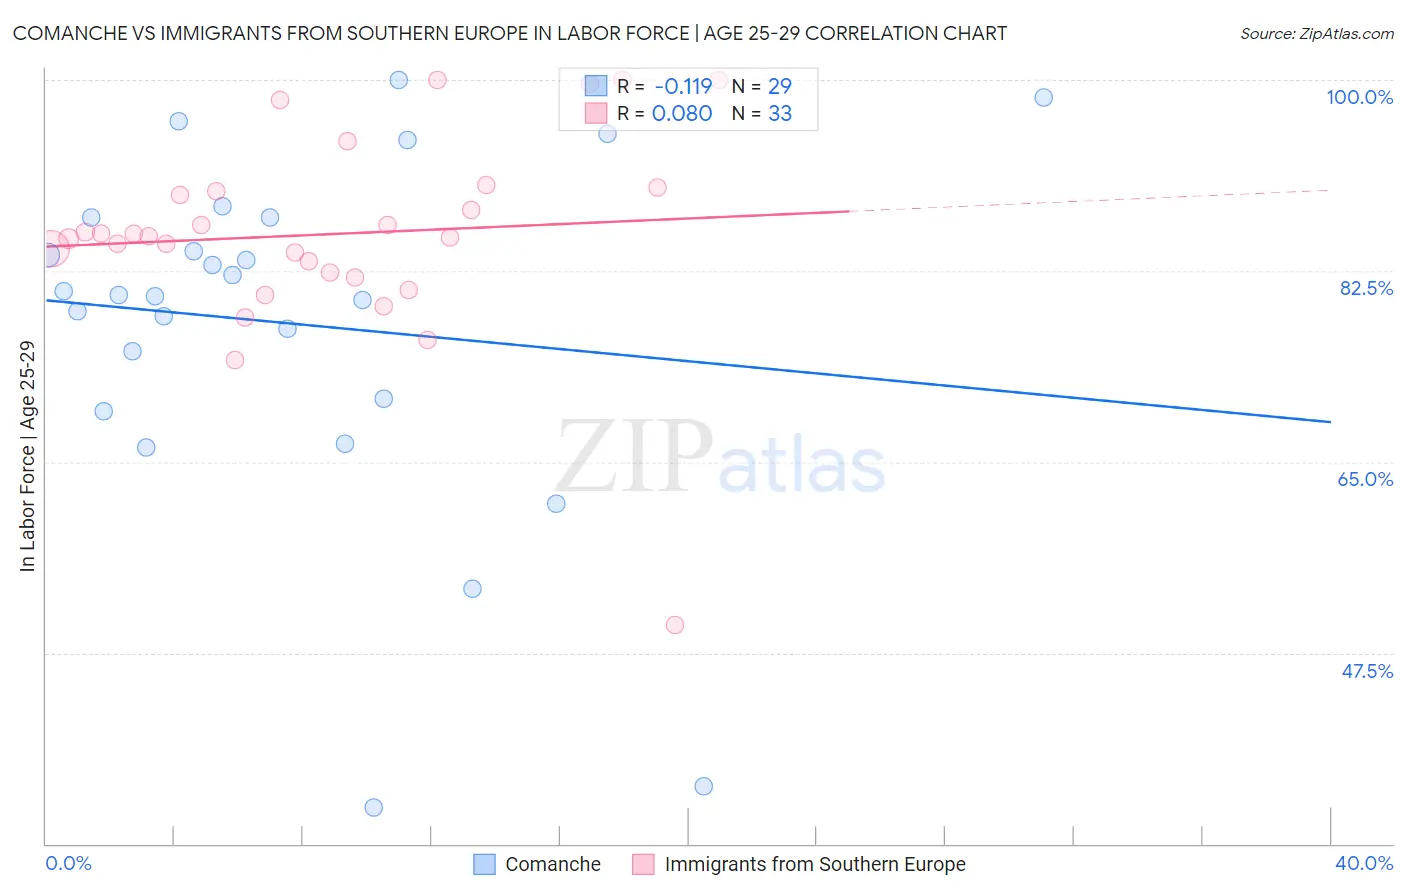
Comanche vs Immigrants from Southern Europe In Labor Force | Age 25-29 Correlation Chart
The statistical analysis conducted on geographies consisting of 109,769,144 people shows a poor negative correlation between the proportion of Comanche and labor force participation rate among population between the ages 25 and 29 in the United States with a correlation coefficient (R) of -0.119 and weighted average of 81.9%. Similarly, the statistical analysis conducted on geographies consisting of 402,654,255 people shows a slight positive correlation between the proportion of Immigrants from Southern Europe and labor force participation rate among population between the ages 25 and 29 in the United States with a correlation coefficient (R) of 0.080 and weighted average of 85.0%, a difference of 3.9%.
In Labor Force | Age 25-29 Correlation Summary
| Measurement | Comanche | Immigrants from Southern Europe |
| Minimum | 33.3% | 50.0% |
| Maximum | 100.0% | 100.0% |
| Range | 66.7% | 50.0% |
| Mean | 77.6% | 85.9% |
| Median | 80.3% | 85.7% |
| Interquartile 25% (IQ1) | 70.2% | 82.1% |
| Interquartile 75% (IQ3) | 87.4% | 90.0% |
| Interquartile Range (IQR) | 17.2% | 7.9% |
| Standard Deviation (Sample) | 16.2% | 9.4% |
| Standard Deviation (Population) | 15.9% | 9.2% |
Similar Demographics by In Labor Force | Age 25-29
Demographics Similar to Comanche by In Labor Force | Age 25-29
In terms of in labor force | age 25-29, the demographic groups most similar to Comanche are Chickasaw (81.9%, a difference of 0.010%), Mexican (81.9%, a difference of 0.090%), Immigrants from Mexico (82.0%, a difference of 0.17%), Seminole (81.7%, a difference of 0.22%), and Colville (81.6%, a difference of 0.27%).
| Demographics | Rating | Rank | In Labor Force | Age 25-29 |
| Alaskan Athabascans | 0.0 /100 | #311 | Tragic 82.3% |
| Hispanics or Latinos | 0.0 /100 | #312 | Tragic 82.2% |
| Yaqui | 0.0 /100 | #313 | Tragic 82.2% |
| Cherokee | 0.0 /100 | #314 | Tragic 82.1% |
| Immigrants | Mexico | 0.0 /100 | #315 | Tragic 82.0% |
| Mexicans | 0.0 /100 | #316 | Tragic 81.9% |
| Chickasaw | 0.0 /100 | #317 | Tragic 81.9% |
| Comanche | 0.0 /100 | #318 | Tragic 81.9% |
| Seminole | 0.0 /100 | #319 | Tragic 81.7% |
| Colville | 0.0 /100 | #320 | Tragic 81.6% |
| Shoshone | 0.0 /100 | #321 | Tragic 81.6% |
| Kiowa | 0.0 /100 | #322 | Tragic 81.6% |
| Alaska Natives | 0.0 /100 | #323 | Tragic 81.6% |
| Houma | 0.0 /100 | #324 | Tragic 81.2% |
| Dutch West Indians | 0.0 /100 | #325 | Tragic 81.1% |
Demographics Similar to Immigrants from Southern Europe by In Labor Force | Age 25-29
In terms of in labor force | age 25-29, the demographic groups most similar to Immigrants from Southern Europe are Immigrants from Hong Kong (85.0%, a difference of 0.010%), Czechoslovakian (85.0%, a difference of 0.010%), Immigrants from Austria (85.0%, a difference of 0.010%), Costa Rican (85.0%, a difference of 0.010%), and New Zealander (85.0%, a difference of 0.020%).
| Demographics | Rating | Rank | In Labor Force | Age 25-29 |
| Immigrants | Switzerland | 93.9 /100 | #100 | Exceptional 85.1% |
| Egyptians | 93.8 /100 | #101 | Exceptional 85.1% |
| Slavs | 93.7 /100 | #102 | Exceptional 85.1% |
| Immigrants | Japan | 93.5 /100 | #103 | Exceptional 85.1% |
| Immigrants | Zaire | 93.3 /100 | #104 | Exceptional 85.1% |
| Immigrants | Hong Kong | 92.8 /100 | #105 | Exceptional 85.0% |
| Czechoslovakians | 92.6 /100 | #106 | Exceptional 85.0% |
| Immigrants | Southern Europe | 92.3 /100 | #107 | Exceptional 85.0% |
| Immigrants | Austria | 91.9 /100 | #108 | Exceptional 85.0% |
| Costa Ricans | 91.9 /100 | #109 | Exceptional 85.0% |
| New Zealanders | 91.5 /100 | #110 | Exceptional 85.0% |
| Immigrants | Middle Africa | 91.4 /100 | #111 | Exceptional 85.0% |
| Senegalese | 90.9 /100 | #112 | Exceptional 85.0% |
| Irish | 90.6 /100 | #113 | Exceptional 85.0% |
| Immigrants | Malaysia | 90.4 /100 | #114 | Exceptional 85.0% |