Chinese vs Norwegian In Labor Force | Age 20-64
COMPARE
Chinese
Norwegian
In Labor Force | Age 20-64
In Labor Force | Age 20-64 Comparison
Chinese
Norwegians
80.7%
IN LABOR FORCE | AGE 20-64
99.9/ 100
METRIC RATING
33rd/ 347
METRIC RANK
81.0%
IN LABOR FORCE | AGE 20-64
100.0/ 100
METRIC RATING
17th/ 347
METRIC RANK
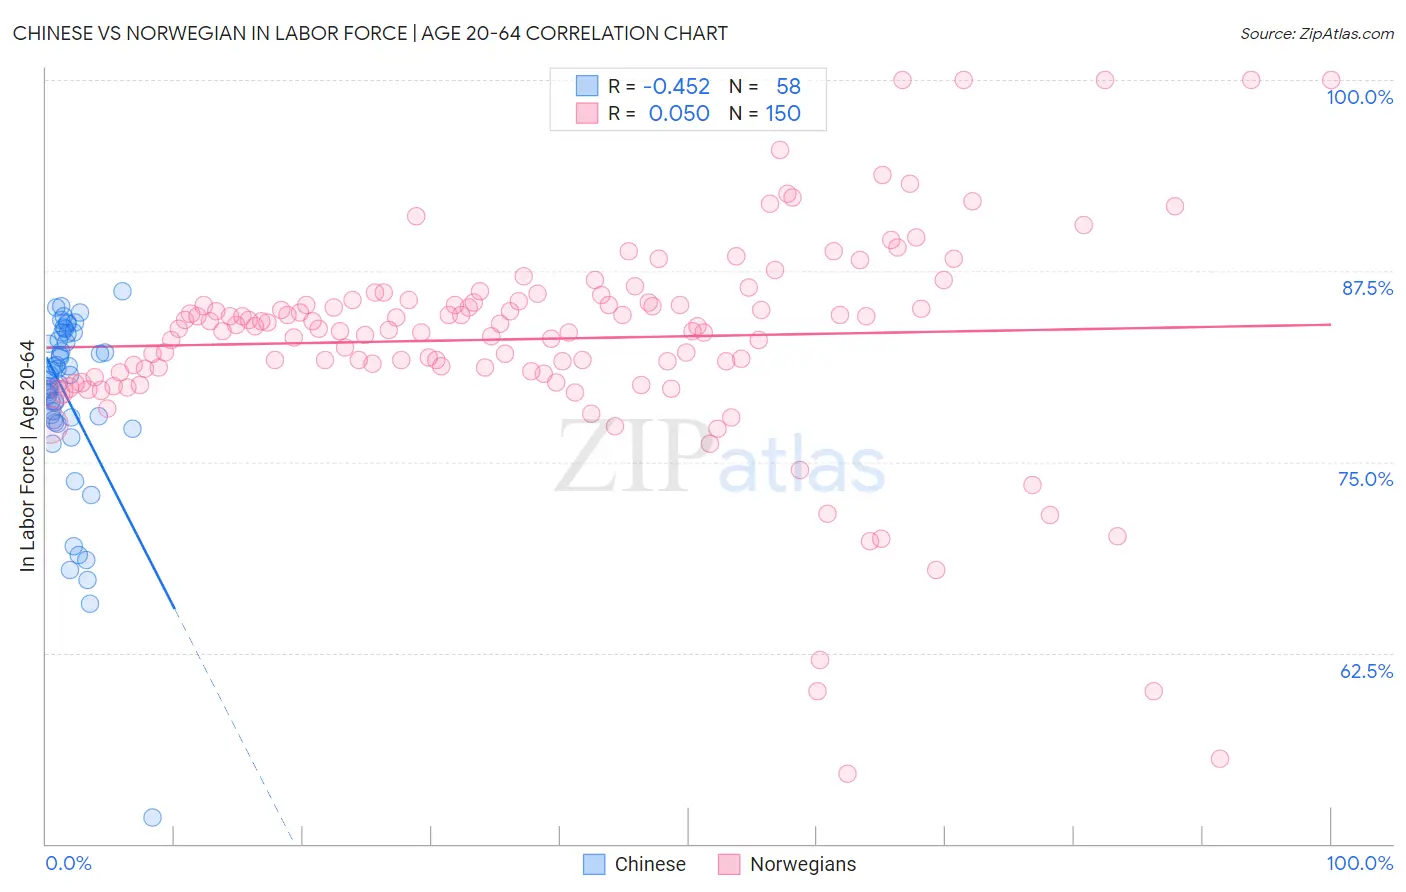
Chinese vs Norwegian In Labor Force | Age 20-64 Correlation Chart
The statistical analysis conducted on geographies consisting of 64,809,125 people shows a moderate negative correlation between the proportion of Chinese and labor force participation rate among population between the ages 20 and 64 in the United States with a correlation coefficient (R) of -0.452 and weighted average of 80.7%. Similarly, the statistical analysis conducted on geographies consisting of 533,390,908 people shows no correlation between the proportion of Norwegians and labor force participation rate among population between the ages 20 and 64 in the United States with a correlation coefficient (R) of 0.050 and weighted average of 81.0%, a difference of 0.36%.
In Labor Force | Age 20-64 Correlation Summary
| Measurement | Chinese | Norwegian |
| Minimum | 51.7% | 54.6% |
| Maximum | 86.2% | 100.0% |
| Range | 34.5% | 45.4% |
| Mean | 79.0% | 83.1% |
| Median | 80.5% | 83.8% |
| Interquartile 25% (IQ1) | 77.7% | 80.9% |
| Interquartile 75% (IQ3) | 83.0% | 85.6% |
| Interquartile Range (IQR) | 5.3% | 4.6% |
| Standard Deviation (Sample) | 6.1% | 7.1% |
| Standard Deviation (Population) | 6.0% | 7.1% |
Demographics Similar to Chinese and Norwegians by In Labor Force | Age 20-64
In terms of in labor force | age 20-64, the demographic groups most similar to Chinese are Immigrants from Brazil (80.7%, a difference of 0.020%), Immigrants from Ireland (80.7%, a difference of 0.030%), Immigrants from Lithuania (80.7%, a difference of 0.040%), Immigrants from Poland (80.6%, a difference of 0.050%), and Immigrants from North Macedonia (80.7%, a difference of 0.060%). Similarly, the demographic groups most similar to Norwegians are Immigrants from Bulgaria (81.0%, a difference of 0.010%), Zimbabwean (81.0%, a difference of 0.020%), Thai (80.9%, a difference of 0.070%), Liberian (80.9%, a difference of 0.080%), and Bulgarian (81.1%, a difference of 0.11%).
| Demographics | Rating | Rank | In Labor Force | Age 20-64 |
| Bulgarians | 100.0 /100 | #15 | Exceptional 81.1% |
| Immigrants | Nepal | 100.0 /100 | #16 | Exceptional 81.1% |
| Norwegians | 100.0 /100 | #17 | Exceptional 81.0% |
| Immigrants | Bulgaria | 100.0 /100 | #18 | Exceptional 81.0% |
| Zimbabweans | 100.0 /100 | #19 | Exceptional 81.0% |
| Thais | 100.0 /100 | #20 | Exceptional 80.9% |
| Liberians | 100.0 /100 | #21 | Exceptional 80.9% |
| Sudanese | 100.0 /100 | #22 | Exceptional 80.8% |
| Immigrants | Bosnia and Herzegovina | 100.0 /100 | #23 | Exceptional 80.8% |
| Immigrants | Morocco | 100.0 /100 | #24 | Exceptional 80.8% |
| Kenyans | 100.0 /100 | #25 | Exceptional 80.8% |
| Immigrants | Serbia | 100.0 /100 | #26 | Exceptional 80.8% |
| Immigrants | Kenya | 99.9 /100 | #27 | Exceptional 80.7% |
| Immigrants | Uganda | 99.9 /100 | #28 | Exceptional 80.7% |
| Immigrants | South Central Asia | 99.9 /100 | #29 | Exceptional 80.7% |
| Immigrants | North Macedonia | 99.9 /100 | #30 | Exceptional 80.7% |
| Immigrants | Lithuania | 99.9 /100 | #31 | Exceptional 80.7% |
| Immigrants | Ireland | 99.9 /100 | #32 | Exceptional 80.7% |
| Chinese | 99.9 /100 | #33 | Exceptional 80.7% |
| Immigrants | Brazil | 99.9 /100 | #34 | Exceptional 80.7% |
| Immigrants | Poland | 99.9 /100 | #35 | Exceptional 80.6% |