Chinese vs Native/Alaskan In Labor Force | Age 20-64
COMPARE
Chinese
Native/Alaskan
In Labor Force | Age 20-64
In Labor Force | Age 20-64 Comparison
Chinese
Natives/Alaskans
80.7%
IN LABOR FORCE | AGE 20-64
99.9/ 100
METRIC RATING
33rd/ 347
METRIC RANK
73.9%
IN LABOR FORCE | AGE 20-64
0.0/ 100
METRIC RATING
333rd/ 347
METRIC RANK
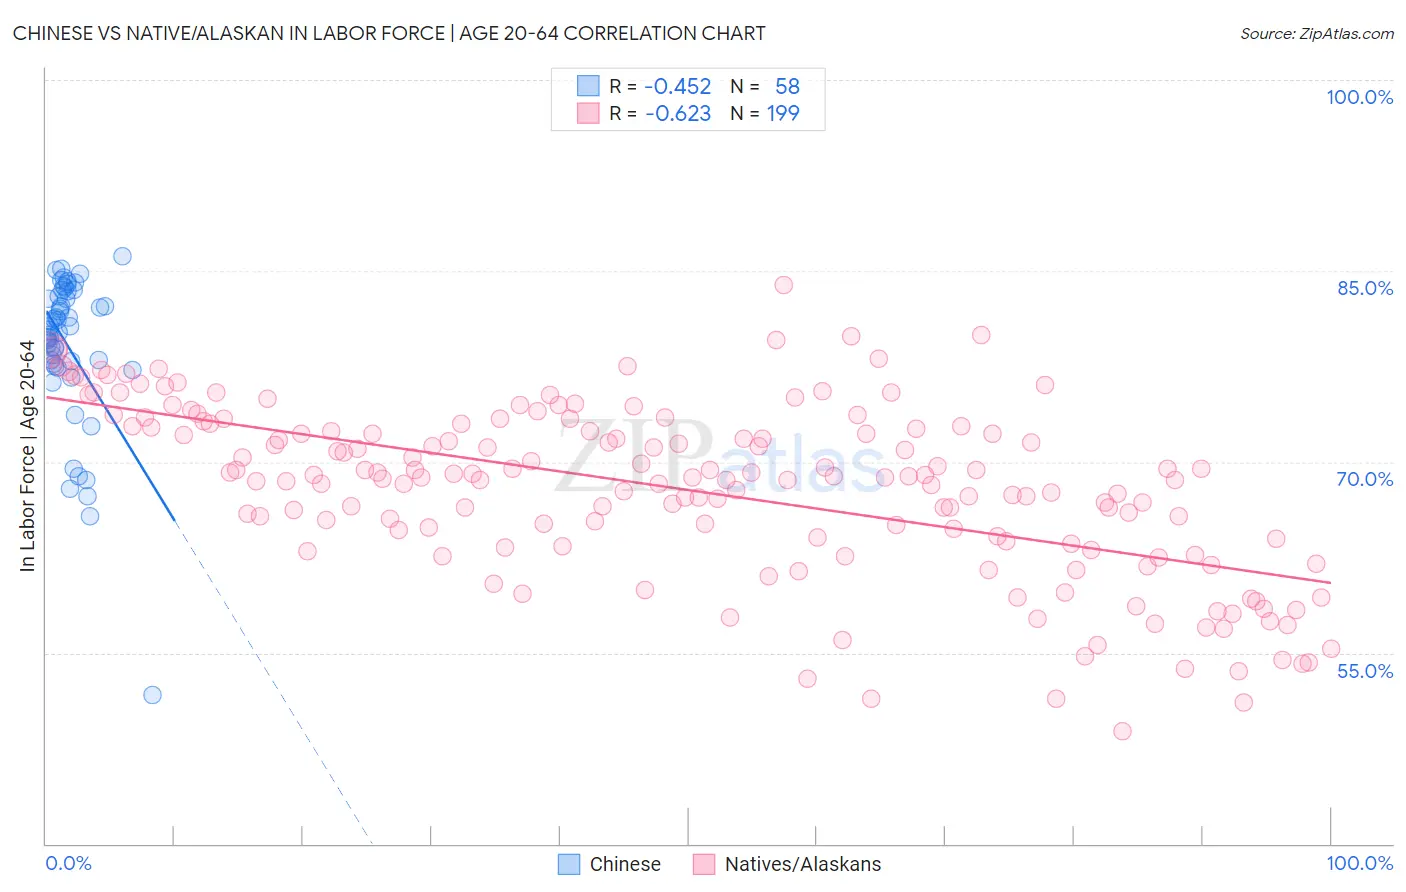
Chinese vs Native/Alaskan In Labor Force | Age 20-64 Correlation Chart
The statistical analysis conducted on geographies consisting of 64,809,125 people shows a moderate negative correlation between the proportion of Chinese and labor force participation rate among population between the ages 20 and 64 in the United States with a correlation coefficient (R) of -0.452 and weighted average of 80.7%. Similarly, the statistical analysis conducted on geographies consisting of 513,028,645 people shows a significant negative correlation between the proportion of Natives/Alaskans and labor force participation rate among population between the ages 20 and 64 in the United States with a correlation coefficient (R) of -0.623 and weighted average of 73.9%, a difference of 9.2%.
In Labor Force | Age 20-64 Correlation Summary
| Measurement | Chinese | Native/Alaskan |
| Minimum | 51.7% | 48.8% |
| Maximum | 86.2% | 83.9% |
| Range | 34.5% | 35.1% |
| Mean | 79.0% | 67.8% |
| Median | 80.5% | 68.8% |
| Interquartile 25% (IQ1) | 77.7% | 63.6% |
| Interquartile 75% (IQ3) | 83.0% | 72.7% |
| Interquartile Range (IQR) | 5.3% | 9.2% |
| Standard Deviation (Sample) | 6.1% | 6.8% |
| Standard Deviation (Population) | 6.0% | 6.8% |
Similar Demographics by In Labor Force | Age 20-64
Demographics Similar to Chinese by In Labor Force | Age 20-64
In terms of in labor force | age 20-64, the demographic groups most similar to Chinese are Immigrants from Brazil (80.7%, a difference of 0.020%), Immigrants from Ireland (80.7%, a difference of 0.030%), Immigrants from Lithuania (80.7%, a difference of 0.040%), Immigrants from Poland (80.6%, a difference of 0.050%), and Immigrants from North Macedonia (80.7%, a difference of 0.060%).
| Demographics | Rating | Rank | In Labor Force | Age 20-64 |
| Immigrants | Serbia | 100.0 /100 | #26 | Exceptional 80.8% |
| Immigrants | Kenya | 99.9 /100 | #27 | Exceptional 80.7% |
| Immigrants | Uganda | 99.9 /100 | #28 | Exceptional 80.7% |
| Immigrants | South Central Asia | 99.9 /100 | #29 | Exceptional 80.7% |
| Immigrants | North Macedonia | 99.9 /100 | #30 | Exceptional 80.7% |
| Immigrants | Lithuania | 99.9 /100 | #31 | Exceptional 80.7% |
| Immigrants | Ireland | 99.9 /100 | #32 | Exceptional 80.7% |
| Chinese | 99.9 /100 | #33 | Exceptional 80.7% |
| Immigrants | Brazil | 99.9 /100 | #34 | Exceptional 80.7% |
| Immigrants | Poland | 99.9 /100 | #35 | Exceptional 80.6% |
| Paraguayans | 99.8 /100 | #36 | Exceptional 80.6% |
| Immigrants | Moldova | 99.8 /100 | #37 | Exceptional 80.6% |
| Ugandans | 99.8 /100 | #38 | Exceptional 80.6% |
| Brazilians | 99.8 /100 | #39 | Exceptional 80.5% |
| Immigrants | Zimbabwe | 99.8 /100 | #40 | Exceptional 80.5% |
Demographics Similar to Natives/Alaskans by In Labor Force | Age 20-64
In terms of in labor force | age 20-64, the demographic groups most similar to Natives/Alaskans are Apache (73.7%, a difference of 0.30%), Ute (73.7%, a difference of 0.32%), Arapaho (74.4%, a difference of 0.66%), Crow (73.3%, a difference of 0.83%), and Yup'ik (73.2%, a difference of 0.95%).
| Demographics | Rating | Rank | In Labor Force | Age 20-64 |
| Creek | 0.0 /100 | #326 | Tragic 75.1% |
| Sioux | 0.0 /100 | #327 | Tragic 75.0% |
| Kiowa | 0.0 /100 | #328 | Tragic 75.0% |
| Cheyenne | 0.0 /100 | #329 | Tragic 74.8% |
| Colville | 0.0 /100 | #330 | Tragic 74.8% |
| Paiute | 0.0 /100 | #331 | Tragic 74.7% |
| Arapaho | 0.0 /100 | #332 | Tragic 74.4% |
| Natives/Alaskans | 0.0 /100 | #333 | Tragic 73.9% |
| Apache | 0.0 /100 | #334 | Tragic 73.7% |
| Ute | 0.0 /100 | #335 | Tragic 73.7% |
| Crow | 0.0 /100 | #336 | Tragic 73.3% |
| Yup'ik | 0.0 /100 | #337 | Tragic 73.2% |
| Puerto Ricans | 0.0 /100 | #338 | Tragic 73.1% |
| Houma | 0.0 /100 | #339 | Tragic 72.7% |
| Pueblo | 0.0 /100 | #340 | Tragic 72.6% |