Immigrants from Western Europe vs Norwegian In Labor Force | Age 20-64
COMPARE
Immigrants from Western Europe
Norwegian
In Labor Force | Age 20-64
In Labor Force | Age 20-64 Comparison
Immigrants from Western Europe
Norwegians
79.1%
IN LABOR FORCE | AGE 20-64
5.9/ 100
METRIC RATING
227th/ 347
METRIC RANK
81.0%
IN LABOR FORCE | AGE 20-64
100.0/ 100
METRIC RATING
17th/ 347
METRIC RANK
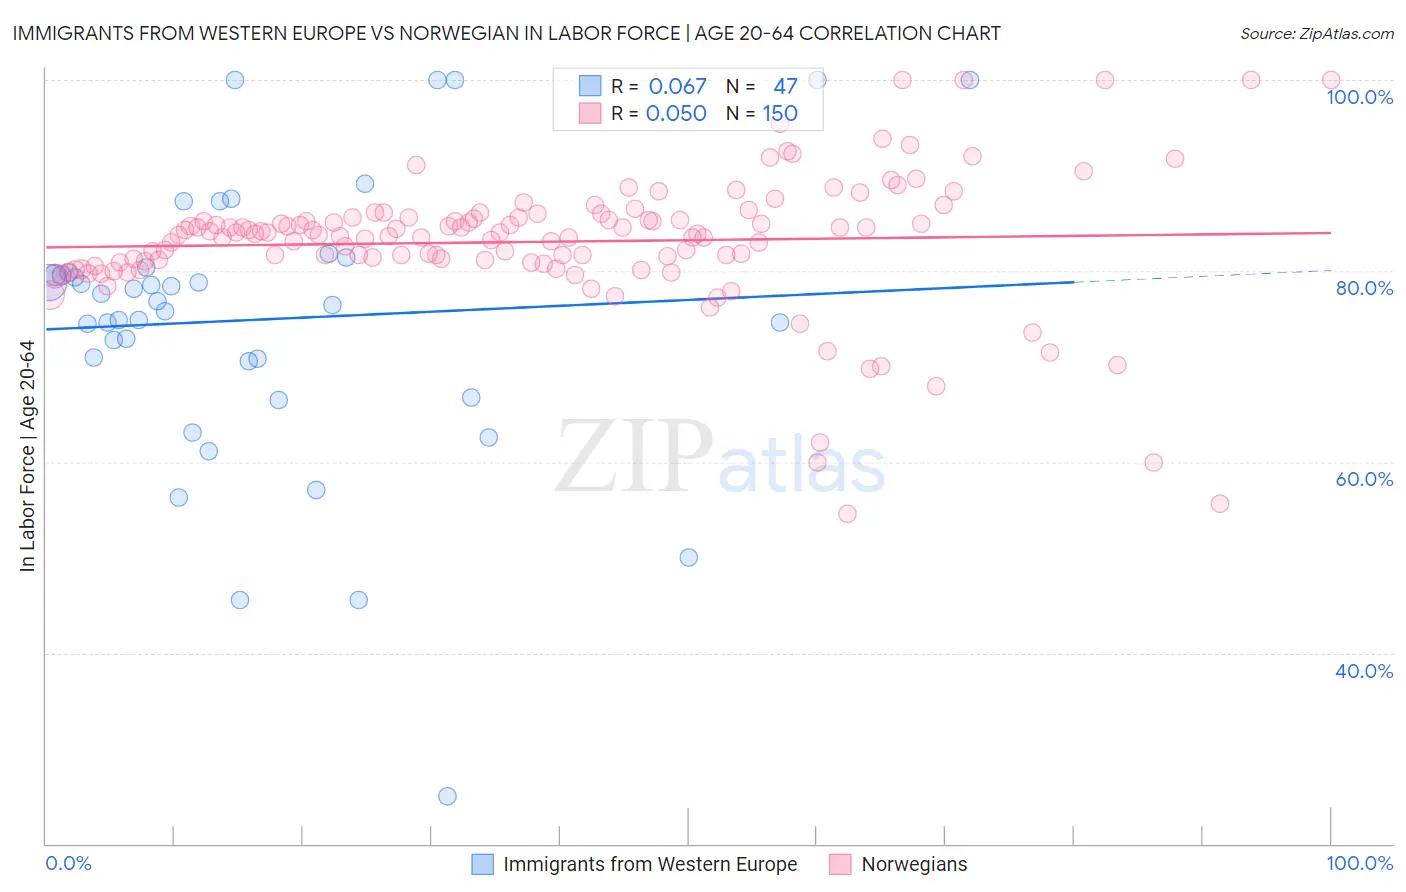
Immigrants from Western Europe vs Norwegian In Labor Force | Age 20-64 Correlation Chart
The statistical analysis conducted on geographies consisting of 494,082,110 people shows a slight positive correlation between the proportion of Immigrants from Western Europe and labor force participation rate among population between the ages 20 and 64 in the United States with a correlation coefficient (R) of 0.067 and weighted average of 79.1%. Similarly, the statistical analysis conducted on geographies consisting of 533,390,908 people shows no correlation between the proportion of Norwegians and labor force participation rate among population between the ages 20 and 64 in the United States with a correlation coefficient (R) of 0.050 and weighted average of 81.0%, a difference of 2.3%.
In Labor Force | Age 20-64 Correlation Summary
| Measurement | Immigrants from Western Europe | Norwegian |
| Minimum | 25.0% | 54.6% |
| Maximum | 100.0% | 100.0% |
| Range | 75.0% | 45.4% |
| Mean | 74.9% | 83.1% |
| Median | 76.8% | 83.8% |
| Interquartile 25% (IQ1) | 70.6% | 80.9% |
| Interquartile 75% (IQ3) | 80.3% | 85.6% |
| Interquartile Range (IQR) | 9.8% | 4.6% |
| Standard Deviation (Sample) | 15.0% | 7.1% |
| Standard Deviation (Population) | 14.8% | 7.1% |
Similar Demographics by In Labor Force | Age 20-64
Demographics Similar to Immigrants from Western Europe by In Labor Force | Age 20-64
In terms of in labor force | age 20-64, the demographic groups most similar to Immigrants from Western Europe are Central American (79.1%, a difference of 0.0%), Panamanian (79.1%, a difference of 0.010%), Alsatian (79.1%, a difference of 0.010%), Native Hawaiian (79.1%, a difference of 0.010%), and Portuguese (79.1%, a difference of 0.020%).
| Demographics | Rating | Rank | In Labor Force | Age 20-64 |
| Immigrants | Immigrants | 7.7 /100 | #220 | Tragic 79.2% |
| Hungarians | 7.2 /100 | #221 | Tragic 79.2% |
| Immigrants | Panama | 6.9 /100 | #222 | Tragic 79.1% |
| Canadians | 6.8 /100 | #223 | Tragic 79.1% |
| Immigrants | Uzbekistan | 6.8 /100 | #224 | Tragic 79.1% |
| Portuguese | 6.4 /100 | #225 | Tragic 79.1% |
| Central Americans | 5.9 /100 | #226 | Tragic 79.1% |
| Immigrants | Western Europe | 5.9 /100 | #227 | Tragic 79.1% |
| Panamanians | 5.7 /100 | #228 | Tragic 79.1% |
| Alsatians | 5.7 /100 | #229 | Tragic 79.1% |
| Native Hawaiians | 5.6 /100 | #230 | Tragic 79.1% |
| Lebanese | 5.1 /100 | #231 | Tragic 79.1% |
| Guamanians/Chamorros | 4.5 /100 | #232 | Tragic 79.1% |
| Japanese | 4.0 /100 | #233 | Tragic 79.1% |
| Immigrants | Canada | 3.2 /100 | #234 | Tragic 79.0% |
Demographics Similar to Norwegians by In Labor Force | Age 20-64
In terms of in labor force | age 20-64, the demographic groups most similar to Norwegians are Immigrants from Bulgaria (81.0%, a difference of 0.010%), Zimbabwean (81.0%, a difference of 0.020%), Thai (80.9%, a difference of 0.070%), Liberian (80.9%, a difference of 0.080%), and Bulgarian (81.1%, a difference of 0.11%).
| Demographics | Rating | Rank | In Labor Force | Age 20-64 |
| Immigrants | Sierra Leone | 100.0 /100 | #10 | Exceptional 81.5% |
| Immigrants | Eastern Africa | 100.0 /100 | #11 | Exceptional 81.3% |
| Immigrants | Eritrea | 100.0 /100 | #12 | Exceptional 81.3% |
| Immigrants | India | 100.0 /100 | #13 | Exceptional 81.3% |
| Cambodians | 100.0 /100 | #14 | Exceptional 81.1% |
| Bulgarians | 100.0 /100 | #15 | Exceptional 81.1% |
| Immigrants | Nepal | 100.0 /100 | #16 | Exceptional 81.1% |
| Norwegians | 100.0 /100 | #17 | Exceptional 81.0% |
| Immigrants | Bulgaria | 100.0 /100 | #18 | Exceptional 81.0% |
| Zimbabweans | 100.0 /100 | #19 | Exceptional 81.0% |
| Thais | 100.0 /100 | #20 | Exceptional 80.9% |
| Liberians | 100.0 /100 | #21 | Exceptional 80.9% |
| Sudanese | 100.0 /100 | #22 | Exceptional 80.8% |
| Immigrants | Bosnia and Herzegovina | 100.0 /100 | #23 | Exceptional 80.8% |
| Immigrants | Morocco | 100.0 /100 | #24 | Exceptional 80.8% |