Chinese vs Norwegian Median Male Earnings
COMPARE
Chinese
Norwegian
Median Male Earnings
Median Male Earnings Comparison
Chinese
Norwegians
$56,872
MEDIAN MALE EARNINGS
91.1/ 100
METRIC RATING
126th/ 347
METRIC RANK
$55,965
MEDIAN MALE EARNINGS
80.9/ 100
METRIC RATING
145th/ 347
METRIC RANK
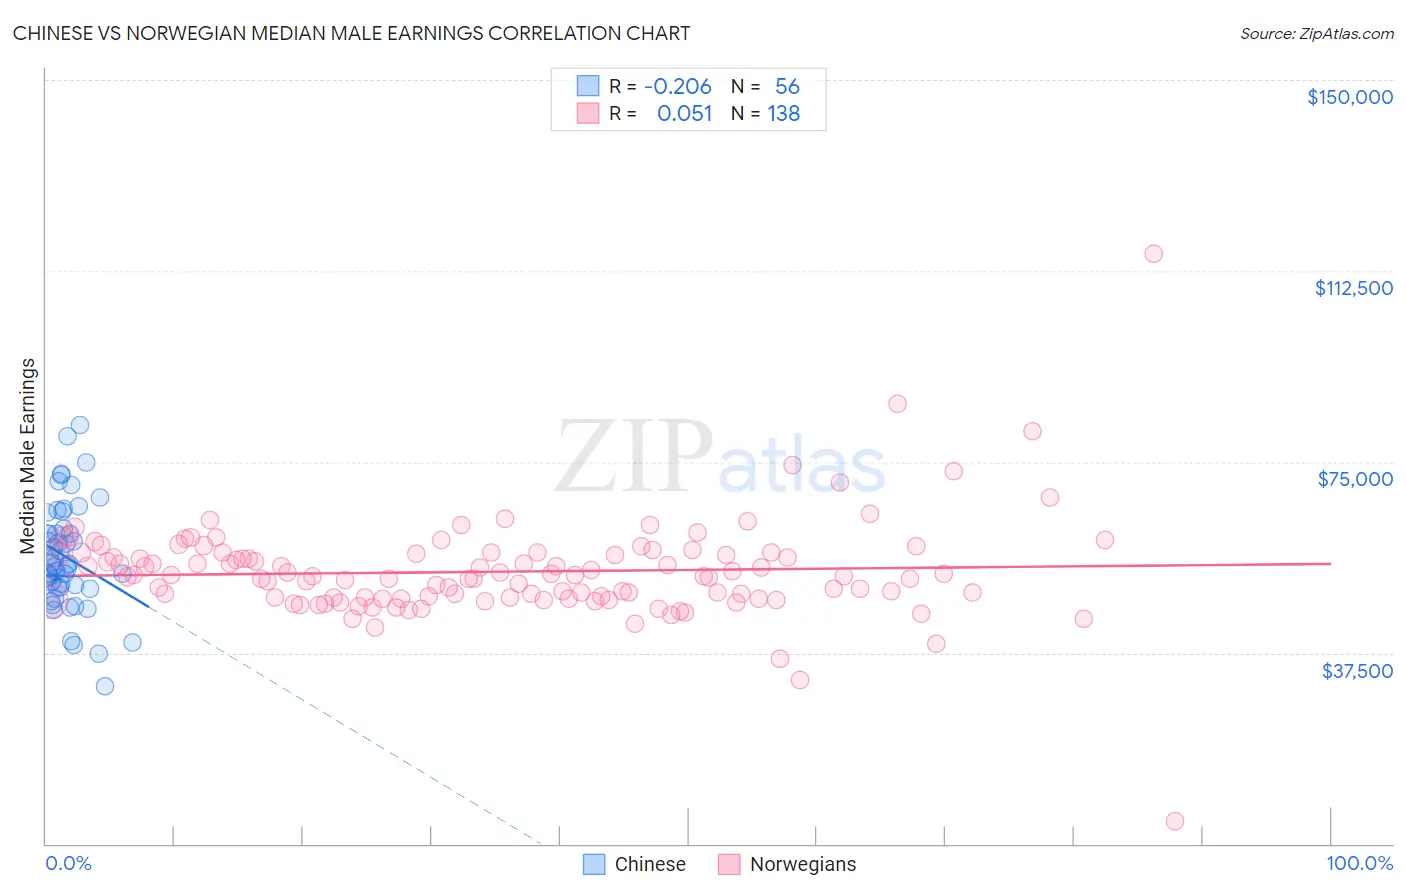
Chinese vs Norwegian Median Male Earnings Correlation Chart
The statistical analysis conducted on geographies consisting of 64,807,348 people shows a weak negative correlation between the proportion of Chinese and median male earnings in the United States with a correlation coefficient (R) of -0.206 and weighted average of $56,872. Similarly, the statistical analysis conducted on geographies consisting of 532,659,369 people shows a slight positive correlation between the proportion of Norwegians and median male earnings in the United States with a correlation coefficient (R) of 0.051 and weighted average of $55,965, a difference of 1.6%.
Median Male Earnings Correlation Summary
| Measurement | Chinese | Norwegian |
| Minimum | $31,000 | $4,318 |
| Maximum | $82,197 | $115,833 |
| Range | $51,197 | $111,515 |
| Mean | $56,277 | $53,449 |
| Median | $54,905 | $52,554 |
| Interquartile 25% (IQ1) | $50,221 | $48,297 |
| Interquartile 75% (IQ3) | $61,384 | $57,158 |
| Interquartile Range (IQR) | $11,163 | $8,861 |
| Standard Deviation (Sample) | $10,489 | $10,042 |
| Standard Deviation (Population) | $10,395 | $10,005 |
Demographics Similar to Chinese and Norwegians by Median Male Earnings
In terms of median male earnings, the demographic groups most similar to Chinese are Brazilian ($56,837, a difference of 0.060%), Immigrants from Syria ($56,830, a difference of 0.070%), Immigrants from Morocco ($56,958, a difference of 0.15%), Pakistani ($56,719, a difference of 0.27%), and Korean ($56,672, a difference of 0.35%). Similarly, the demographic groups most similar to Norwegians are Immigrants from Uganda ($56,064, a difference of 0.18%), Sri Lankan ($56,136, a difference of 0.31%), Danish ($56,246, a difference of 0.50%), Ethiopian ($56,243, a difference of 0.50%), and Zimbabwean ($56,302, a difference of 0.60%).
| Demographics | Rating | Rank | Median Male Earnings |
| Immigrants | Morocco | 91.8 /100 | #125 | Exceptional $56,958 |
| Chinese | 91.1 /100 | #126 | Exceptional $56,872 |
| Brazilians | 90.9 /100 | #127 | Exceptional $56,837 |
| Immigrants | Syria | 90.8 /100 | #128 | Exceptional $56,830 |
| Pakistanis | 89.9 /100 | #129 | Excellent $56,719 |
| Koreans | 89.4 /100 | #130 | Excellent $56,672 |
| Portuguese | 89.4 /100 | #131 | Excellent $56,663 |
| Czechs | 88.2 /100 | #132 | Excellent $56,546 |
| Immigrants | Germany | 88.2 /100 | #133 | Excellent $56,542 |
| Moroccans | 87.7 /100 | #134 | Excellent $56,499 |
| Irish | 87.4 /100 | #135 | Excellent $56,464 |
| Immigrants | Saudi Arabia | 87.2 /100 | #136 | Excellent $56,452 |
| Slavs | 86.5 /100 | #137 | Excellent $56,390 |
| Slovaks | 85.5 /100 | #138 | Excellent $56,306 |
| Zimbabweans | 85.5 /100 | #139 | Excellent $56,302 |
| Luxembourgers | 85.5 /100 | #140 | Excellent $56,300 |
| Danes | 84.8 /100 | #141 | Excellent $56,246 |
| Ethiopians | 84.8 /100 | #142 | Excellent $56,243 |
| Sri Lankans | 83.4 /100 | #143 | Excellent $56,136 |
| Immigrants | Uganda | 82.4 /100 | #144 | Excellent $56,064 |
| Norwegians | 80.9 /100 | #145 | Excellent $55,965 |