Chinese vs Norwegian Female Unemployment
COMPARE
Chinese
Norwegian
Female Unemployment
Female Unemployment Comparison
Chinese
Norwegians
4.5%
FEMALE UNEMPLOYMENT
100.0/ 100
METRIC RATING
7th/ 347
METRIC RANK
4.2%
FEMALE UNEMPLOYMENT
100.0/ 100
METRIC RATING
1st/ 347
METRIC RANK
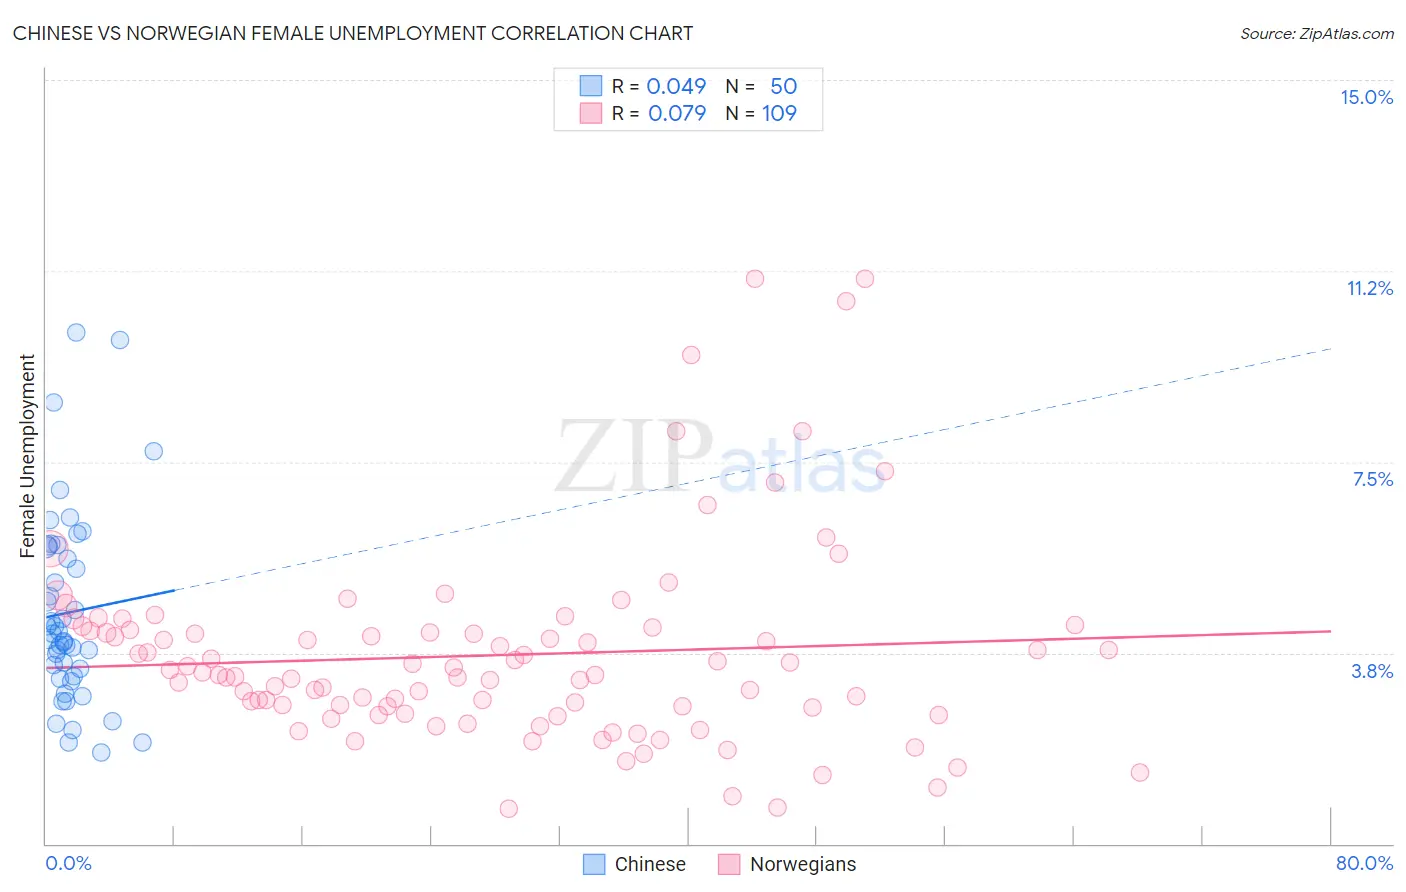
Chinese vs Norwegian Female Unemployment Correlation Chart
The statistical analysis conducted on geographies consisting of 64,725,695 people shows no correlation between the proportion of Chinese and unemploymnet rate among females in the United States with a correlation coefficient (R) of 0.049 and weighted average of 4.5%. Similarly, the statistical analysis conducted on geographies consisting of 523,312,817 people shows a slight positive correlation between the proportion of Norwegians and unemploymnet rate among females in the United States with a correlation coefficient (R) of 0.079 and weighted average of 4.2%, a difference of 7.6%.
Female Unemployment Correlation Summary
| Measurement | Chinese | Norwegian |
| Minimum | 1.8% | 0.68% |
| Maximum | 10.0% | 11.1% |
| Range | 8.2% | 10.4% |
| Mean | 4.5% | 3.7% |
| Median | 4.1% | 3.3% |
| Interquartile 25% (IQ1) | 3.3% | 2.6% |
| Interquartile 75% (IQ3) | 5.8% | 4.2% |
| Interquartile Range (IQR) | 2.5% | 1.6% |
| Standard Deviation (Sample) | 1.9% | 1.9% |
| Standard Deviation (Population) | 1.9% | 1.9% |
Demographics Similar to Chinese and Norwegians by Female Unemployment
In terms of female unemployment, the demographic groups most similar to Chinese are German (4.5%, a difference of 0.020%), Slovene (4.5%, a difference of 0.38%), Swedish (4.4%, a difference of 0.77%), Swiss (4.6%, a difference of 1.7%), and Scandinavian (4.6%, a difference of 1.8%). Similarly, the demographic groups most similar to Norwegians are Czech (4.4%, a difference of 5.3%), Luxembourger (4.4%, a difference of 5.3%), Danish (4.4%, a difference of 5.4%), Hmong (4.4%, a difference of 5.5%), and Swedish (4.4%, a difference of 6.8%).
| Demographics | Rating | Rank | Female Unemployment |
| Norwegians | 100.0 /100 | #1 | Exceptional 4.2% |
| Czechs | 100.0 /100 | #2 | Exceptional 4.4% |
| Luxembourgers | 100.0 /100 | #3 | Exceptional 4.4% |
| Danes | 100.0 /100 | #4 | Exceptional 4.4% |
| Hmong | 100.0 /100 | #5 | Exceptional 4.4% |
| Swedes | 100.0 /100 | #6 | Exceptional 4.4% |
| Chinese | 100.0 /100 | #7 | Exceptional 4.5% |
| Germans | 100.0 /100 | #8 | Exceptional 4.5% |
| Slovenes | 100.0 /100 | #9 | Exceptional 4.5% |
| Swiss | 100.0 /100 | #10 | Exceptional 4.6% |
| Scandinavians | 100.0 /100 | #11 | Exceptional 4.6% |
| Dutch | 100.0 /100 | #12 | Exceptional 4.6% |
| Belgians | 100.0 /100 | #13 | Exceptional 4.6% |
| Finns | 100.0 /100 | #14 | Exceptional 4.6% |
| English | 100.0 /100 | #15 | Exceptional 4.6% |
| Carpatho Rusyns | 99.9 /100 | #16 | Exceptional 4.7% |
| Croatians | 99.9 /100 | #17 | Exceptional 4.7% |
| Latvians | 99.9 /100 | #18 | Exceptional 4.7% |
| Poles | 99.9 /100 | #19 | Exceptional 4.7% |
| Bulgarians | 99.9 /100 | #20 | Exceptional 4.7% |